Content
Published:
This is an archived release.
Pronounced decline in manufacturing turnover
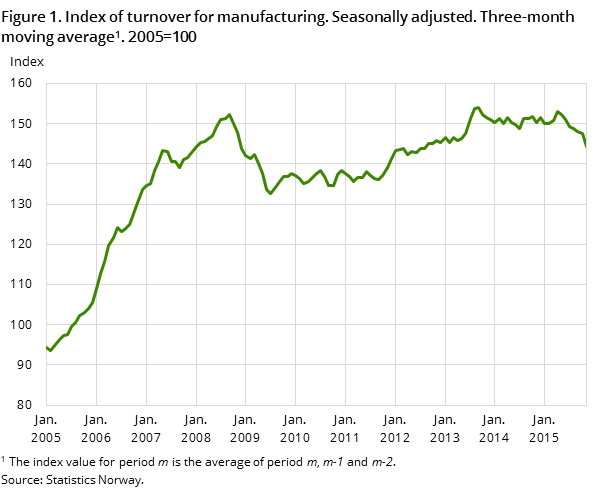
Seasonally-adjusted figures show that the total turnover in Norwegian manufacturing decreased by 3.0 per cent from September to November compared to the previous three-month period. A decline of 4.6 per cent is also recorded from October to November.
| Seasonally adjusted | Calendar adjusted1 | Unadjusted | ||
|---|---|---|---|---|
| Monthly change | Three-month change | Twelve-month change | NOK million | |
| November 2015 / October 2015 | September 2015 - November 2015 / June 2015 - August 2015 | November 2015 / November 2014 | November 2015 | |
| 1Adjusted for working-days and for public holidays in Norway. | ||||
| Extraction, mining, manufacturing and elec | -3.7 | -3.7 | -10.4 | 128 458 |
| Extraction and related services | -4.3 | -7.4 | -13.4 | 48 396 |
| Mining and quarrying | -1.7 | -10.5 | -12.9 | 1 206 |
| Manufacturing | -4.6 | -3.0 | -8.9 | 68 188 |
| Food, beverages and tobacco | 0.7 | 1.6 | 5.4 | 20 058 |
| Refined petro., chemicals, pharmac. | -3.4 | -0.2 | -10.2 | 9 962 |
| Basic metals | 6.8 | -6.9 | -3.0 | 4 662 |
| Machinery and equipment | -11.2 | -6.6 | -27.4 | 6 355 |
| Ships, boats and oil platforms | -1.6 | -16.7 | -35.0 | 4 115 |
| Electricity, gas and steam | 4.0 | 15.0 | -5.2 | 10 669 |


The index value for turnover in manufacturing was 144.3 (2005=100) in the period September to November 2015, compared to 148.8 in the previous three-month period, according to seasonally-adjusted figures.
Three-month change: strong fall in building of ships, boats and oil platforms
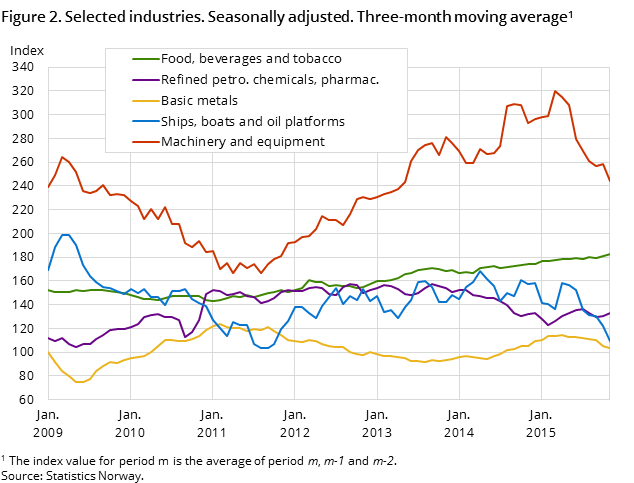
The seasonally-adjusted figures show that the biggest contributor to the 3.0 per cent downturn in manufacturing turnover in September to November 2015 was building of ships, boats and oil platforms, which went down 16.7 per cent. Lower investment activity in the oil and gas sector is contributing to this development .The decline in manufacturing turnover was further enhanced by a downturn in the turnover for basic metals. Statistics Norway’s producer price index shows that metal prices have declined in eight successive months. The fall in prices contributes to the decline in turnover for basic metals. Repair and installation of machinery and fabricated metal products also experienced a decline in turnover.
Conversely, food products showed a growth and partially offset the decrease in total turnover in this period.
Monthly change: machinery and equipment fell the most
Total Norwegian manufacturing turnover went down 4.6 per cent from October to November 2015, according to seasonally-adjusted figures. Machinery and equipment (down 11.2 per cent) and the grouping refined petroleum, chemicals and pharmaceutical products (down 3.4 per cent) contributed the most to the negative development.
Conversely, basic metals rose by 6.8 per cent.
Twelve-month change: building of ships, boats and oil platforms and machinery and equipment post the largest decrease
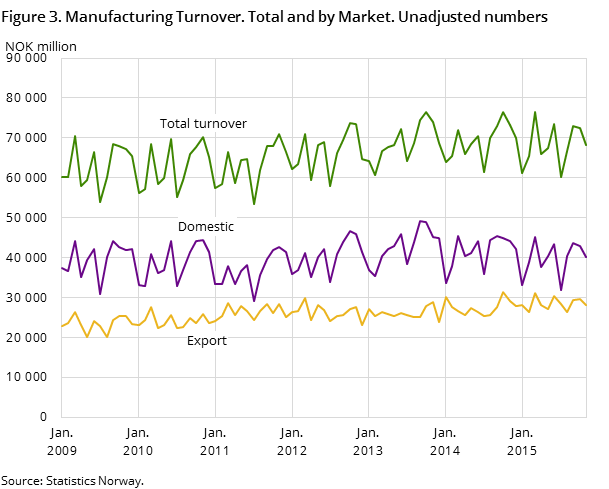
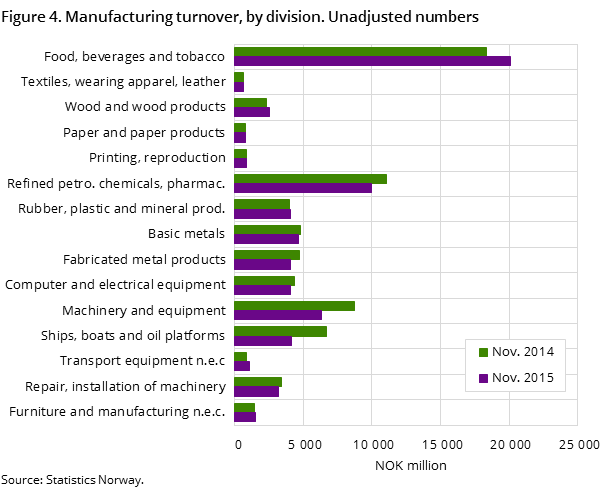
Calendar-adjusted figures showed that the total turnover went down 8.9 per cent in November 2015 compared to November 2014. Both the domestic and export market showed a decline, of 10.2 and 7.1 per cent respectively.
Both building of ships, boats and oil platforms and machinery and equipment showed a significant decline of 27.6 and 35 per cent respectively. However, a 5.9 per cent growth in the food industry curbed the fall in the twelve-month change.
Monthly change: rise in the euro area and fall in Norway in October 2015
Norwegian manufacturing turnover went down 0.9 per cent from September to October 2015 according to seasonally-adjusted figures. Manufacturing turnover in the euro area faced an increase of 1.3 per cent. In the Nordic countries, Sweden and Denmark showed a decrease of 0.5 and 1.3 per cent respectively from September to October 2015, according to Eurostat.
Figures for Support activities for petroleum and natural gas extraction are now in StatbankOpen and readClose
From October 2015, figures for Support activities for petroleum and natural gas extraction on will be published. According to SIC2007, Services in oil and gas extraction is grouped in section B Mining and quarrying. Producers within this industry supply, among other things, services related to drilling in exploration, appraisal and production wells, together with other services related to offshore activities such as installation of floating and fixed structures both above and below the sea floor. The time series is from the year 2014. This industry has always been a part of the aggregate Extraction and related services, but now its time series is published separately in Statbank and tables.
Find more figures
Find detailed figures from Turnover in oil and gas, manufacturing, mining and electricity supply
Additional information
The variation in manufacturing turnover can be related to changes in volume and price indices in different industries and also production to stocks and sales from stocks.
Contact
-
Robert Skotvold
E-mail: robert.skotvold@ssb.no
tel.: (+47) 40 90 24 44
-
Anne Karin Linderud Haugen
E-mail: anne.karin.linderud.haugen@ssb.no
tel.: (+47) 91 88 19 76
