Content
Published:
This is an archived release.
The tables were corrected at 2:30 pm 7 September 2015.The error concerned domestic and export figures for extraction and related services.
Fall in manufacturing turnover
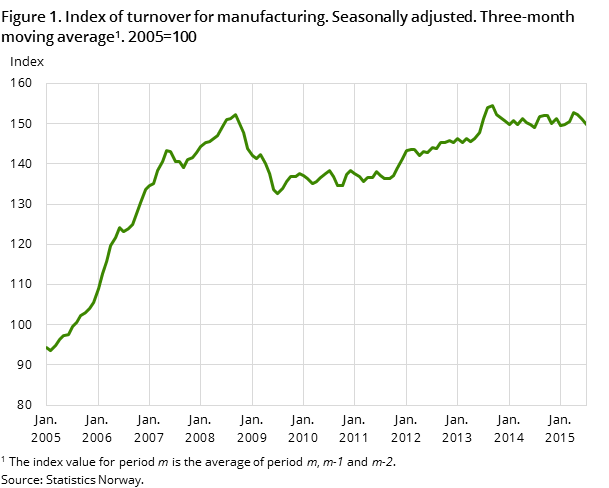
Seasonally-adjusted figures showed that the total turnover in Norwegian manufacturing decreased by 1.9 per cent from May to July 2015 compared to the previous three-month period. There was a decline from June to July of 1.1 per cent.
| Seasonally adjusted | Calendar adjusted1 | Unadjusted | ||
|---|---|---|---|---|
| Monthly change | Three-month change | Twelve-month change | NOK million | |
| July 2015 / June 2015 | May 2015 - July 2015 / February 2015 - April 2015 | July 2015 / July 2014 | July 2015 | |
| 1Adjusted for working-days and for public holidays in Norway. | ||||
| Extraction, mining, manufacturing and elec | -5.3 | -0.1 | -7.0 | 118 429 |
| Extraction and related services | -11.3 | 4.7 | -10.5 | 50 196 |
| Mining and quarrying | -0.8 | -1.0 | 4.9 | 1 123 |
| Manufacturing | -1.1 | -1.9 | -1.5 | 60 489 |
| Food, beverages and tobacco | 0.7 | -0.1 | 5.3 | 17 412 |
| Refined petro., chemicals, pharmac. | -6.9 | 4.2 | -8.2 | 10 551 |
| Basic metals | -0.2 | -1.6 | 10.5 | 5 036 |
| Machinery and equipment | -5.4 | -13.6 | -14.1 | 5 836 |
| Ships, boats and oil platforms | 15.6 | -9.4 | 10.6 | 4 741 |
| Electricity, gas and steam | 0.0 | -12.4 | -24.9 | 6 621 |


The index value for turnover in manufacturing was 149.9 (2005=100) in the period May to July 2015, compared to 152.8 in the previous quarter, according to seasonally-adjusted figures.
Three-month change: pronounced fall in machinery and equipment
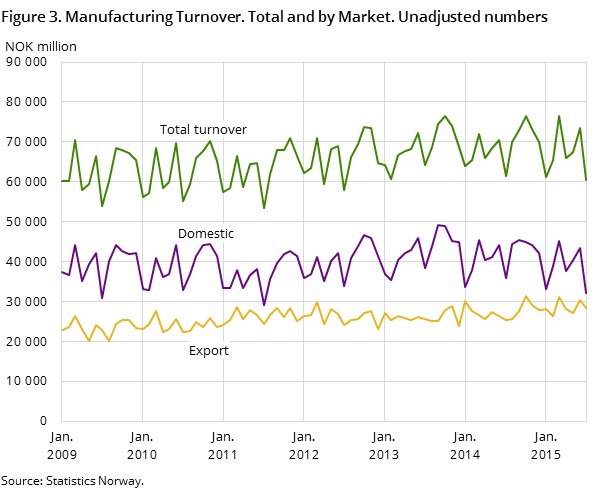
Seasonally-adjusted figures showed that the turnover in Norwegian manufacturing increased 1.9 per cent from May to July compared with the previous three-month period. The domestic market fell 5.9 per cent. In the export market the turnover was up 3.5 per cent.
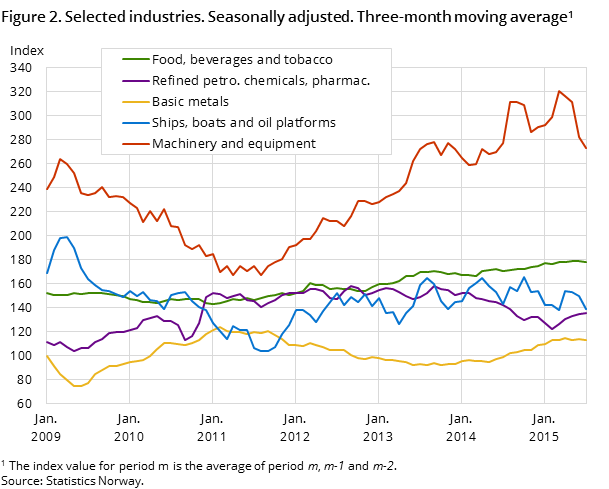
Most of the industries contributed to an increase in the total turnover in the period May to July 2015 compared to the previous three-month period.
The biggest contributor to the development was the industry machinery and equipment, with a decline of 13.6 per cent. In addition, the producers of ships, boats and oil platforms also showed a pronounced negative trend in the period.
The grouping refined petroleum, chemical and pharmaceutical industries was up 4.2 per cent. Together with food products, which had an increase of 0.4 per cent, the grouping helped to curb the decrease in total turnover in Norwegian manufacturing.
Monthly change: notable growth in turnover for building of ships, boats and oil platforms industry in July
Total Norwegian manufacturing turnover went down 1.1 per cent from June to July 2015, according to seasonally-adjusted figures.
The grouping refined petroleum, chemical and pharmaceutical industries edged down 6.9 per cent. Machinery and equipment still have a negative development due to lower demand and production in recent periods.
The biggest contribution to limiting the decline in the total turnover was from the producers of boats, ships and oil platforms, which had an increase of 15.6 per cent. The growth is related to several large deliveries in this period.
Twelve-month change: notable growth for food products from June 2014
Calendar-adjusted figures showed an increase of 1.5 per cent in total manufacturing turnover in July 2015 compared to July 2014. While the export market enjoyed 11.4 per cent growth, the domestic market faced a 10.5 per cent decline.
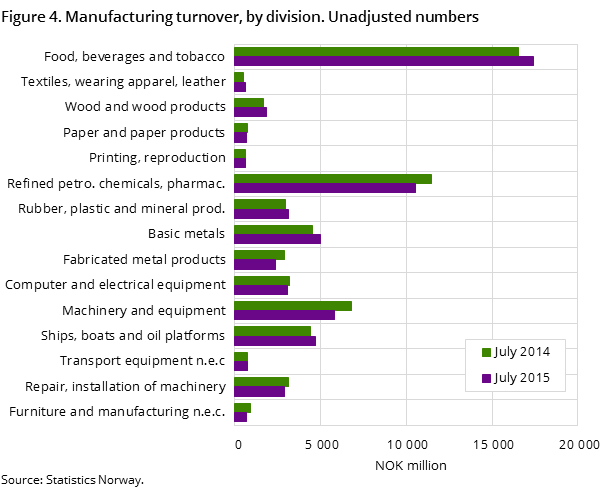
The biggest contributors to the development in total turnover were the grouping refined petroleum, chemical and pharmaceutical industries, and machinery and equipment, with a fall of 8.2 and 14.1 per cent respectively. Growth in the food industry curbed the fall in the twelve-month change.
Monthly change: slight changes in Norway and the euro area from May to June 2015
Manufacturing turnover in the euro area and Norway went down 0.8 per cent from May to June 2015 according to seasonally-adjusted figures. In the Nordic countries, Sweden and Denmark showed an increase of 3.4 and 2.1 per cent respectively, according to Eurostat.
Find more figures
Find detailed figures from Turnover in oil and gas, manufacturing, mining and electricity supply
Additional information
The variation in manufacturing turnover can be related to changes in volume and price indices in different industries and also production to stocks and sales from stocks.
Contact
-
Robert Skotvold
E-mail: robert.skotvold@ssb.no
tel.: (+47) 40 90 24 44
-
Anne Karin Linderud Haugen
E-mail: anne.karin.linderud.haugen@ssb.no
tel.: (+47) 91 88 19 76
