Content
Published:
This is an archived release.
Increase in turnover
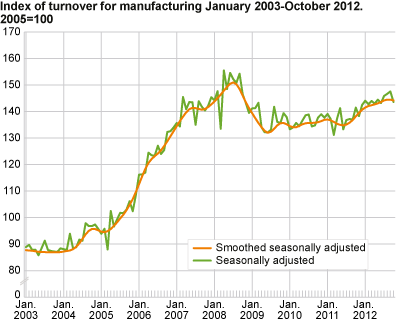
Seasonally-adjusted figures show an increase of 1.0 per cent in the turnover in Norwegian manufacturing from August 2012 to October 2012 compared to the previous three-month period.
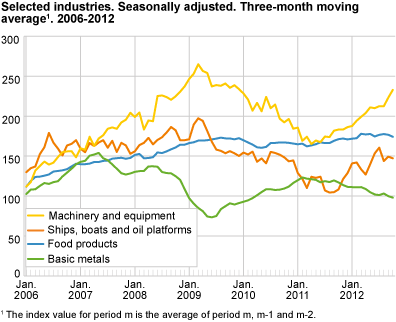
The biggest contribution to the rise in manufacturing turnover came from the grouping refined petroleum, chemicals and pharmaceutical, which showed an increase of 7.9 per cent. Turnover in both the export and the domestic market went up. In addition, machinery and equipment shows steady growth, increasing by 9.6 per cent, due to higher production volume. Fabricated metal product turnover also showed growth, up 4.1 per cent in the same period.
Industries with reduced turnover included building of ships, boats and oil platforms, which dropped 8.3 per cent. This fall in turnover was because a number of major deliveries took place in the previous period. Within non-ferrous metals, turnover fell by 5.7 per cent as a result of lower production volume, (see producer price index ).
Fall in turnover from September to October
Seasonally-adjusted figures showed that total Norwegian manufacturing turnover fell by 2.8 per cent from September to October 2012. Building of ships, boats and oil platforms sank because of fewer deliveries, by 11.7 per cent. In addition, planned stops at some refinery installations played a role in reducing the total turnover.
Industries with increased turnover in this period included repair, installation of machinery, with a 25.7 per cent increase and basic metals, increasing 4.4 per cent.
Growth from October 2011
Unadjusted figures showed an increase of 8.4 per cent in total manufacturing turnover in October 2012 compared to October 2011. The largest growth in turnover was for building of ships, boats and oil platforms, with a solid 29.2 per cent increase. Machinery and equipment also had the same increase. Both industries are important suppliers to the oil and gas industry, which is currently experiencing record high investment levels, see index of production and investments in oil and gas activity .
Turnover within basic metals was 9.7 per cent lower than in October 2011, particularly within non-ferrous metals, which fell 12.7 per cent.
Norway and the euro area
Seasonally-adjusted figures show that Norwegian manufacturing turnover went up by 0.7 per cent from August to September 2012. Manufacturing turnover in the euro area went down 3.0 per cent in the same period, according to figures published by Eurostat .
|
Original series.1 January-October 2012 |
Changes in per cent.
January-October 2011- January-October 2012 |
Original series.1 October 2012 |
Changes in per cent.
October 2011-October 2012 |
Changes in per cent.
Seasonally adjusted. May 2012-July 2012- August 2012-October 2012 |
|||||||||||||||||||||||||||||||||||||||||||||||||||||||||||||||||||||||||||
|---|---|---|---|---|---|---|---|---|---|---|---|---|---|---|---|---|---|---|---|---|---|---|---|---|---|---|---|---|---|---|---|---|---|---|---|---|---|---|---|---|---|---|---|---|---|---|---|---|---|---|---|---|---|---|---|---|---|---|---|---|---|---|---|---|---|---|---|---|---|---|---|---|---|---|---|---|---|---|---|
| The overall turnover | 1 373 619 | 6.4 | 148 230 | 12.7 | -0.6 | ||||||||||||||||||||||||||||||||||||||||||||||||||||||||||||||||||||||||||
| Extraction and related services | 612 755 | 13.2 | 63 571 | 19.3 | -3.5 | ||||||||||||||||||||||||||||||||||||||||||||||||||||||||||||||||||||||||||
| Manufacturing, mining and quarrying | 672 506 | 6.2 | 75 018 | 8.2 | 0.4 | ||||||||||||||||||||||||||||||||||||||||||||||||||||||||||||||||||||||||||
| Domestic market | 410 454 | 9.8 | 48 051 | 10.0 | 1.8 | ||||||||||||||||||||||||||||||||||||||||||||||||||||||||||||||||||||||||||
| Export market | 262 052 | 1.0 | 26 967 | 5.2 | -0.9 | ||||||||||||||||||||||||||||||||||||||||||||||||||||||||||||||||||||||||||
| Electricity, Gas and Steam Supply | 88 359 | -24.1 | 9 641 | 8.1 | 4.2 | ||||||||||||||||||||||||||||||||||||||||||||||||||||||||||||||||||||||||||
| Main industrial groupings | |||||||||||||||||||||||||||||||||||||||||||||||||||||||||||||||||||||||||||||||
| Intermediate goods | 320 501 | 4.7 | 35 573 | 10.8 | 1.2 | ||||||||||||||||||||||||||||||||||||||||||||||||||||||||||||||||||||||||||
| Capital goods | 189 436 | 17.4 | 21 847 | 21.8 | 1.2 | ||||||||||||||||||||||||||||||||||||||||||||||||||||||||||||||||||||||||||
| Consumer goods | 162 330 | 2.3 | 18 988 | 4.9 | -2.5 | ||||||||||||||||||||||||||||||||||||||||||||||||||||||||||||||||||||||||||
| Energy goods | 701 353 | 5.5 | 71 822 | 13.3 | -3.4 | ||||||||||||||||||||||||||||||||||||||||||||||||||||||||||||||||||||||||||
| 1 | NOK million. |
Interpretation of seasonally-adjusted figuresIn order to facilitate the interpretation of the short-term development, statistics on turnover publishes three-month moving averages of the seasonally-adjusted figures. A comparison is normally made between the latest non-overlapping three-month periods (for instance May to July compared with August to October). |
The relationship between production and turnoverThe development in the turnover can be related to changes in both volume and prices in the different industries. Production to stocks and sales from stocks can also take place. Reporting of large deliveries of capital goods can contribute to differences in the development in the index of production and the statistics on turnover. |
Find more figures
Find detailed figures from Turnover in oil and gas, manufacturing, mining and electricity supply
Additional information
The variation in manufacturing turnover can be related to changes in volume and price indices in different industries and also production to stocks and sales from stocks.
Contact
-
Robert Skotvold
E-mail: robert.skotvold@ssb.no
tel.: (+47) 40 90 24 44
-
Anne Karin Linderud Haugen
E-mail: anne.karin.linderud.haugen@ssb.no
tel.: (+47) 91 88 19 76


