Content
Published:
This is an archived release.
Small increase in manufacturing turnover
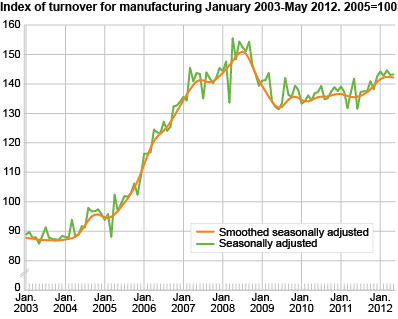
Turnover in Norwegian manufacturing increased by 0.3 per cent from March to May 2012 compared to the previous three-month period, according to seasonally-adjusted figures.
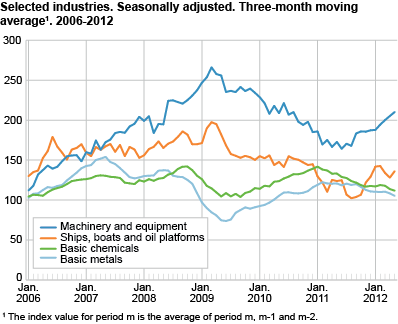
The largest contribution came from food products, which were up 3.1 per cent due to higher prices and larger production volume. See the Producer price index . Machinery and equipment also showed positive figures and went up by 8.1 per cent. This was due to higher turnover within the domestic market as a result of high investment levels within the oil and gas sector, see Investment statistics on oil and gas activity . In addition, turnover in computer and electrical equipment increased by 1.8 per cent.
Several industries saw reduced turnover in this three-month period, including basic metals, which fell 4.3 per cent. The reason for this was lower prices, particularly within non-ferrous metals, where prices have dropped since March this year, see the Producer price index . In addition, turnover within basic chemicals went down by 6.0 per cent, and paper and paper products dropped 2.2 per cent. The decline in both the Norwegian solar industry and the paper industry pushed the index down.
Small increase in turnover from April to May
Seasonally-adjusted figures showed that total Norwegian manufacturing turnover went up by 0.1 per cent from April to May 2012. Deliveries within building of ships, boats and oil platforms resulted in a solid 27.6 per cent increase in turnover. Machinery and equipment rose 3.4 per cent. Repair and installation of machinery went up by 2.4 per cent. Other groupings experienced a fall in turnover. Among those with a low turnover was the grouping refined petroleum, chemicals and pharmaceutical with a drop of 5.2 per cent, mainly due to a price fall within refined petroleum products, see the Producer price index .
Increase from May 2011 to May 2012
Unadjusted figures showed an increase of 4.4 per cent in total manufacturing turnover in May 2012 compared to May 2011. Turnover in the domestic market grew by 8.6, while dropping 1.5 per cent within the export market. Building of ships, boats and oil platforms had the largest growth in turnover, up 53.6 per cent. This was followed by repair and installation of machinery, with an increase of 20.4 per cent. Machinery and equipment also went up 14.5 per cent.
Industries with a drop in turnover were metals and basic chemicals, down 18.3 and 13.7 per cent respectively. These changes show clear sector differences within Norwegian manufacturing.
|
Original series.1 January-May 2012 |
Changes in per cent.
January-May 2011- January-May 2012 |
Original series.1 May 2012 |
Changes in per cent.
May 2011-May 2012 |
Changes in per cent.
Seasonally adjusted. December 2011-February 2012- March 2012-May 2012 |
|||||||||||||||||||||||||||||||||||||||||||||||||||||||||||||||||||||||||||
|---|---|---|---|---|---|---|---|---|---|---|---|---|---|---|---|---|---|---|---|---|---|---|---|---|---|---|---|---|---|---|---|---|---|---|---|---|---|---|---|---|---|---|---|---|---|---|---|---|---|---|---|---|---|---|---|---|---|---|---|---|---|---|---|---|---|---|---|---|---|---|---|---|---|---|---|---|---|---|---|
| The overall turnover | 710 228 | 8.5 | 138 698 | 11.4 | 0.9 | ||||||||||||||||||||||||||||||||||||||||||||||||||||||||||||||||||||||||||
| Extraction and related services | 329 001 | 20.9 | 61 737 | 30.8 | -0.3 | ||||||||||||||||||||||||||||||||||||||||||||||||||||||||||||||||||||||||||
| Manufacturing, mining and quarrying | 328 930 | 6.0 | 68 565 | 4.4 | 0.6 | ||||||||||||||||||||||||||||||||||||||||||||||||||||||||||||||||||||||||||
| Domestic market | 195 924 | 8.0 | 41 579 | 8.6 | 0.1 | ||||||||||||||||||||||||||||||||||||||||||||||||||||||||||||||||||||||||||
| Export market | 133 006 | 3.3 | 26 986 | -1.4 | -0.1 | ||||||||||||||||||||||||||||||||||||||||||||||||||||||||||||||||||||||||||
| Electricity, Gas and Steam Supply | 52 297 | -27.3 | 8 396 | -28.3 | -4.0 | ||||||||||||||||||||||||||||||||||||||||||||||||||||||||||||||||||||||||||
| Main industrial groupings | |||||||||||||||||||||||||||||||||||||||||||||||||||||||||||||||||||||||||||||||
| Intermediate goods | 153 890 | 4.6 | 32 750 | -0.4 | 1.2 | ||||||||||||||||||||||||||||||||||||||||||||||||||||||||||||||||||||||||||
| Capital goods | 91 758 | 13.2 | 19 715 | 22.6 | -1.5 | ||||||||||||||||||||||||||||||||||||||||||||||||||||||||||||||||||||||||||
| Consumer goods | 79 517 | 3.3 | 16 288 | 2.5 | 3.0 | ||||||||||||||||||||||||||||||||||||||||||||||||||||||||||||||||||||||||||
| Energy goods | 385 063 | 10.2 | 69 945 | 17.2 | -0.4 | ||||||||||||||||||||||||||||||||||||||||||||||||||||||||||||||||||||||||||
| 1 | NOK million. |
Interpretation of seasonally-adjusted figuresIn order to facilitate the interpretation of the short-term development, statistics on turnover publishes three-month moving averages of the seasonally-adjusted figures. We normally compare the latest non-overlapping three-month periods (for instance December to February compared with March to May). |
The relationship between production and turnoverThe development in the turnover can be related to changes in both volume and prices in the different industries. Production to stocks and sales from stocks can also take place. Reporting of large deliveries of capital goods can contribute to differences in the development in the index of production and the statistics on turnover. |
Find more figures
Find detailed figures from Turnover in oil and gas, manufacturing, mining and electricity supply
Additional information
The variation in manufacturing turnover can be related to changes in volume and price indices in different industries and also production to stocks and sales from stocks.
Contact
-
Robert Skotvold
E-mail: robert.skotvold@ssb.no
tel.: (+47) 40 90 24 44
-
Anne Karin Linderud Haugen
E-mail: anne.karin.linderud.haugen@ssb.no
tel.: (+47) 91 88 19 76