Content
Published:
This is an archived release.
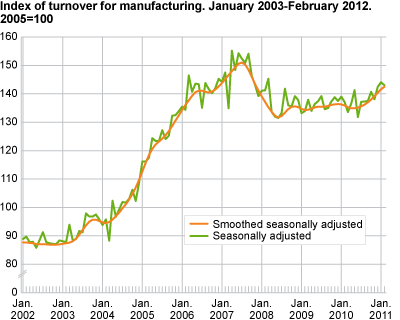
Growth in turnover
Turnover in Norwegian manufacturing increased by 3.2 per cent from December to February 2012 compared to the previous three-month period, according to seasonally-adjusted figures.
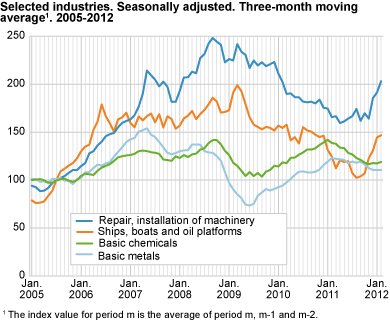
This was due to a 5.2 per cent increase in turnover within the domestic market. Figures within the export market were nearly unchanged. Industries with a strong increase in turnover included repair, installation of machinery, up 23.9 per cent. Building of ship and oil platforms also went up, by 19.4 per cent. Meanwhile refined petroleum, chemicals and pharmaceutical went up by 3.1 per cent. Despite the lower production volume within the latter grouping, higher prices resulted in increased turnover.
Among industries with a reduced turnover were basic metals, falling by 1.7 per cent due a lower production volume.
Unchanged turnover from January to February
Seasonally-adjusted figures showed that total Norwegian manufacturing turnover was almost unchanged from January to February. Repair and installation of machinery increased by 4.2 per cent. While fabricated metal products grew 2.5 per cent. Conversely, computer and electrical equipment dropped 5.1 per cent.
Increase from February 2011 to February 2012
Unadjusted figures showed an increase of 8.5 per cent in total manufacturing turnover in February 2012 compared to February 2011. Both the domestic and the export market grew in turnover by 11.6 and 4.4 per cent respectively. Large contributors were fabricated metal products, up 22.3 per cent and food products by 8.1 per cent. This was followed by refined petroleum, chemicals and pharmaceutical, which increased by 5.8 per cent. This growth is mainly a result of higher prices in the last twelve-month period, see the Producer price index .
The opposite was the case for non-ferrous metals, where turnover fell by 9.6 per cent.
|
Original series.1 January-February 2012 |
Changes in per cent.
January-February 2011- January-February 2012 |
Original series.1 February 2012 |
Changes in per cent.
February 2011-February 2012 |
Changes in per cent.
Seasonally adjusted. September 2011-November 2011- Desember 2011-February 2012 |
|||||||||||||||||||||||||||||||||||||||||||||||||||||||||||||||||||||||||||
|---|---|---|---|---|---|---|---|---|---|---|---|---|---|---|---|---|---|---|---|---|---|---|---|---|---|---|---|---|---|---|---|---|---|---|---|---|---|---|---|---|---|---|---|---|---|---|---|---|---|---|---|---|---|---|---|---|---|---|---|---|---|---|---|---|---|---|---|---|---|---|---|---|---|---|---|---|---|---|---|
| The overall turnover | 289 231 | 11.7 | 147 316 | 18.7 | 4.2 | ||||||||||||||||||||||||||||||||||||||||||||||||||||||||||||||||||||||||||
| Extraction and related services | 134 019 | 24.0 | 68 741 | 37.1 | 7.5 | ||||||||||||||||||||||||||||||||||||||||||||||||||||||||||||||||||||||||||
| Manufacturing, mining and quarrying | 127 938 | 8.7 | 64 653 | 9.0 | 3.3 | ||||||||||||||||||||||||||||||||||||||||||||||||||||||||||||||||||||||||||
| Domestic market | 75 671 | 9.3 | 38 685 | 12.2 | 5.2 | ||||||||||||||||||||||||||||||||||||||||||||||||||||||||||||||||||||||||||
| Export market | 52 266 | 7.9 | 25 968 | 4.5 | - | ||||||||||||||||||||||||||||||||||||||||||||||||||||||||||||||||||||||||||
| Electricity, Gas and Steam Supply | 27 274 | -17.6 | 13 921 | -4.9 | 8.9 | ||||||||||||||||||||||||||||||||||||||||||||||||||||||||||||||||||||||||||
| Main industrial groupings | |||||||||||||||||||||||||||||||||||||||||||||||||||||||||||||||||||||||||||||||
| Intermediate goods | 59 284 | 7.9 | 29 530 | 6.8 | 1.6 | ||||||||||||||||||||||||||||||||||||||||||||||||||||||||||||||||||||||||||
| Capital goods | 35 625 | 16.9 | 18 360 | 21.4 | 11.4 | ||||||||||||||||||||||||||||||||||||||||||||||||||||||||||||||||||||||||||
| Consumer goods | 30 876 | 3.3 | 15 728 | 2.5 | -0.8 | ||||||||||||||||||||||||||||||||||||||||||||||||||||||||||||||||||||||||||
| Energy goods | 163 445 | 13.8 | 83 697 | 26.8 | 8.9 | ||||||||||||||||||||||||||||||||||||||||||||||||||||||||||||||||||||||||||
| 1 | NOK million. |
Interpretation of seasonally-adjusted figuresIn order to facilitate the interpretation of the short-term development, statistics on turnover publishes three-month moving averages of the seasonally-adjusted figures. We normally compare the latest non-overlapping three-month periods (for instance September to November compared with December to February). |
The relationship between production and turnoverThe development in the turnover can be related to changes in both volume and prices in the different industries. Production to stocks and sales from stocks can also happen. Reporting of large deliveries of capital goods can contribute to differences in the development in the index of production and the statistics on turnover. |
Find more figures
Find detailed figures from Turnover in oil and gas, manufacturing, mining and electricity supply
Additional information
The variation in manufacturing turnover can be related to changes in volume and price indices in different industries and also production to stocks and sales from stocks.
Contact
-
Robert Skotvold
E-mail: robert.skotvold@ssb.no
tel.: (+47) 40 90 24 44
-
Anne Karin Linderud Haugen
E-mail: anne.karin.linderud.haugen@ssb.no
tel.: (+47) 91 88 19 76