Content
Published:
This is an archived release.
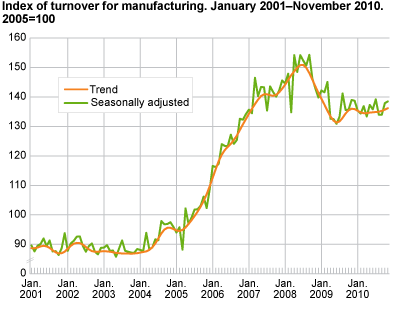
Unchanged manufacturing turnover
The total turnover in Norwegian manufacturing went up 0.5 per cent from September to November 2010 compared to the previous three-month period, according to seasonally-adjusted figures.
Among the industries that reported a growth in turnover in this last three-month period was refined petroleum, chemicals and pharmaceutical with a 2.9 per cent increase, partially due to a higher production volume, see Index of production . Machinery and installation went up by 4.5 per cent, completion and delivery of large projects is the major reason behind this development. Both computer and electrical equipment and the grouping building of ships, boats and oil platforms showed an increase in turnover, up 1.7 and 2..2 per cent respectively from September to November 2010 compared to the previous three-month period. Meanwhile, turnover for food products remained unchanged in the same period.
Turnover from October to November 2010
Seasonally-adjusted figures revealed that the turnover in Norwegian manufacturing went up by 0.5 per cent from October to November 2010. The biggest growth in turnover was to be seen within refined petroleum, chemicals and pharmaceutical, up 14.7 per cent. Positive results were also seen in machinery and equipment, with an increased turnover of 8.2 per cent and within repair, installation of machinery with 6.2 per cent. On the other hand, fabricated metal products showed a fall of 11 per cent.
Increased turnover from November 2009
Unadjusted figures showed that the total manufacturing turnover incremented by 4.9 per cent since the same month last year. Industries with increased turnover included refined petroleum, chemicals and pharmaceutical, up 29 per cent, basic metals up 28.3 per cent and computer and electrical equipment up 11.1 per cent. This tendency is explained by a combination of the increased production volume and price that these industries have experienced since November 2009, see the index of production and producer price index .
Industrial groupings with reduced turnover in this period included machinery and equipment, down 12.6 per cent and repair, installation of machinery with an 11.5 per cent fall.
Norway and the euro area
Unadjusted figures show that there was a 0.3 per cent decrease in Norwegian manufacturing turnover from October 2009 to October 2010. Manufacturing turnover in the euro area went up 8.5 per cent in the same period, according to figures published by Eurostat . These figures must be considered in relation to the fact that the decline in Norwegian industry was not as pronounced as in the countries in the EU, and had a different course due to differences in the structure of industry.
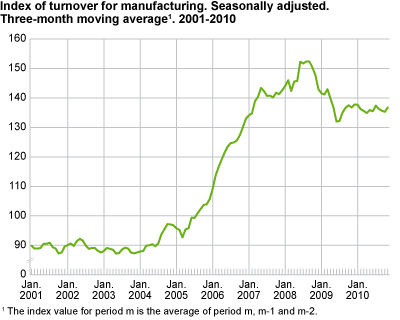
Interpretation of seasonally-adjusted figuresIn order to facilitate the interpretation of the short-term development, statistics on turnover publishes three-month moving averages of the seasonally-adjusted figures. We normally compare the latest non-overlapping three-month periods (for instance September to November compared with June to August). |
The relationship between production and turnoverThe development in the turnover can be related to changes in both volume and prices in the different industries. Production to stocks and sales from stocks can also happen. Reporting during large deliveries of capital goods can contribute to differences in the development in the index of production and the statistics on turnover. |
|
New table in StatBank From November 2010, series on annual figures are published in the StatBank (table 08534). Annual figures are calculated as the arithmetic mean of the unadjusted monthly figures. |
| Original series.1
January-November 2010 |
Changes in per cent. January-November 2009- January-November 2010 |
Original series.1
November 2010 |
Changes in per cent. November 2009- November 2010 |
Changes in per cent. Seasonally adjusted. June 2010-August 2010- September 2010-November 2010 |
|||||||||||||||||||||||||||||||||||||||||||||||||||||||||||||||||||||||||||
|---|---|---|---|---|---|---|---|---|---|---|---|---|---|---|---|---|---|---|---|---|---|---|---|---|---|---|---|---|---|---|---|---|---|---|---|---|---|---|---|---|---|---|---|---|---|---|---|---|---|---|---|---|---|---|---|---|---|---|---|---|---|---|---|---|---|---|---|---|---|---|---|---|---|---|---|---|---|---|---|
| The overall turnover | 1 337 079 | 4.3 | 136 660 | 10.7 | 4.7 | ||||||||||||||||||||||||||||||||||||||||||||||||||||||||||||||||||||||||||
| Extraction and related services | 502 980 | 3.9 | 50 518 | 10.1 | 8.3 | ||||||||||||||||||||||||||||||||||||||||||||||||||||||||||||||||||||||||||
| Manufacturing, mining and quarrying | 700 564 | -0.5 | 71 810 | 5.0 | 0.3 | ||||||||||||||||||||||||||||||||||||||||||||||||||||||||||||||||||||||||||
| Domestic market | 441 146 | -2.8 | 46 226 | 5.4 | 0.2 | ||||||||||||||||||||||||||||||||||||||||||||||||||||||||||||||||||||||||||
| Export market | 259 420 | 3.7 | 25 584 | 4.4 | -2.6 | ||||||||||||||||||||||||||||||||||||||||||||||||||||||||||||||||||||||||||
| Electricity, Gas and Steam Supply | 133 537 | 42.6 | 14 333 | 55.8 | 3.0 | ||||||||||||||||||||||||||||||||||||||||||||||||||||||||||||||||||||||||||
| Main industrial groupings | |||||||||||||||||||||||||||||||||||||||||||||||||||||||||||||||||||||||||||||||
| Intermediate goods | 305 727 | 8.9 | 30 612 | 15.0 | 0.8 | ||||||||||||||||||||||||||||||||||||||||||||||||||||||||||||||||||||||||||
| Capital goods | 209 721 | -11.4 | 20 659 | -7.0 | 0.4 | ||||||||||||||||||||||||||||||||||||||||||||||||||||||||||||||||||||||||||
| Consumer goods | 178 513 | -2.1 | 18 637 | 0.8 | -0.2 | ||||||||||||||||||||||||||||||||||||||||||||||||||||||||||||||||||||||||||
| Energy goods | 643 116 | 10.6 | 66 752 | 18.9 | 10.3 | ||||||||||||||||||||||||||||||||||||||||||||||||||||||||||||||||||||||||||
| 1 | NOK million. |
Tables
Find more figures
Find detailed figures from Turnover in oil and gas, manufacturing, mining and electricity supply
Additional information
The variation in manufacturing turnover can be related to changes in volume and price indices in different industries and also production to stocks and sales from stocks.
Contact
-
Robert Skotvold
E-mail: robert.skotvold@ssb.no
tel.: (+47) 40 90 24 44
-
Anne Karin Linderud Haugen
E-mail: anne.karin.linderud.haugen@ssb.no
tel.: (+47) 91 88 19 76