Content
Published:
This is an archived release.
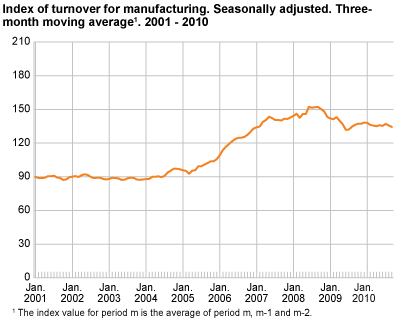
Stable manufacturing turnover
Seasonally-adjusted figures show a small decrease of 0.7 per cent in the turnover in Norwegian manufacturing from the second quarter of 2010 to the third quarter of 2010.
The turnover in Norwegian manufacturing went up by 0.4 per cent in the domestic market but went down by 2.3 per cent in the export market.
The industry that reported the greatest decline in turnover from the second quarter of 2010 to the third quarter of 2010 was refined petroleum, chemicals and pharmaceutical products with a fall of 13.4 per cent. The turnover also went down in machinery and equipment, by 7.1 per cent. The decline was mainly caused by a lower turnover in the domestic market.
On the other hand, industries with a higher turnover included building of ships, boats and oil platforms, which had an increase of 6.1 per cent. This industry also experienced a higher production volume from the second to the third quarter of 2010, (see the index of production ). Within rubber, plastic and mineral products the turnover increased by 4.7 per cent, mainly due to the development in the domestic market. An increase was also reported in the food products industry. The increase was 2.5 per cent from the second to the third quarter of 2010.
Lower turnover in September
The turnover in Norwegian manufacturing fell by 1 per cent from August to September 2010, according to seasonally-adjusted figures. The fall was most pronounced with 19 per cent within the industry refined petroleum, chemicals and pharmaceutical products.
Decrease in September 2010 compared to September 2009
Unadjusted figures showed a fall of 5.3 per cent in total manufacturing turnover in September 2010 compared to September 2009. The strongest fall was within refined petroleum, chemicals and pharmaceutical products and equipment by 23 per cent. The turnover within machinery and ships, boats and oil platforms was down by 20.8 and 13 per cent respectively. The turnover fell by 7.5 per cent in food products.
Norway and the Euro area
Unadjusted figures show that there was a 1.4 per cent increase in Norwegian manufacturing turnover from August 2009 to August 2010. Manufacturing turnover in the Euro area went up 15 per cent in the same period, according to figures published by Eurostat . These figures must be considered in relation to the fact that the decline in Norwegian industry was not as pronounced as in the countries in the EU, and had a different course due to differences in the structure of industry.
| Original series.1
January-September 2010 |
Changes in per cent. January-September 2009- January-September 2010 |
Original series.1
September 2010 |
Changes in per cent. September 2009- September 2010 |
Changes in per cent. Seasonally adjusted. April 2010-June 2010- July 2010-September 2010 |
|||||||||||||||||||||||||||||||||||||||||||||||||||||||||||||||||||||||||||
|---|---|---|---|---|---|---|---|---|---|---|---|---|---|---|---|---|---|---|---|---|---|---|---|---|---|---|---|---|---|---|---|---|---|---|---|---|---|---|---|---|---|---|---|---|---|---|---|---|---|---|---|---|---|---|---|---|---|---|---|---|---|---|---|---|---|---|---|---|---|---|---|---|---|---|---|---|---|---|---|
| The overall turnover | 1 073 413 | 3.7 | 119 508 | 3.8 | -4.2 | ||||||||||||||||||||||||||||||||||||||||||||||||||||||||||||||||||||||||||
| Extraction and related services | 407 387 | 3.4 | 42 816 | 8.7 | -7.6 | ||||||||||||||||||||||||||||||||||||||||||||||||||||||||||||||||||||||||||
| Manufacturing, mining and quarrying | 558 264 | -1.4 | 66 293 | -5.2 | -0.5 | ||||||||||||||||||||||||||||||||||||||||||||||||||||||||||||||||||||||||||
| Domestic market | 348 427 | -4.6 | 42 616 | -7.3 | 1.0 | ||||||||||||||||||||||||||||||||||||||||||||||||||||||||||||||||||||||||||
| Export market | 209 838 | 4.5 | 23 676 | -1.1 | 1.9 | ||||||||||||||||||||||||||||||||||||||||||||||||||||||||||||||||||||||||||
| Electricity, Gas and Steam Supply | 107 763 | 42.8 | 10 399 | 78.3 | -6.4 | ||||||||||||||||||||||||||||||||||||||||||||||||||||||||||||||||||||||||||
| Main industrial groupings | |||||||||||||||||||||||||||||||||||||||||||||||||||||||||||||||||||||||||||||||
| Intermediate goods | 245 105 | 8.2 | 31 643 | 10.9 | 3.1 | ||||||||||||||||||||||||||||||||||||||||||||||||||||||||||||||||||||||||||
| Capital goods | 169 329 | -12.4 | 19 679 | -12.1 | -0.8 | ||||||||||||||||||||||||||||||||||||||||||||||||||||||||||||||||||||||||||
| Consumer goods | 140 433 | -2.8 | 17 663 | -4.0 | 1.7 | ||||||||||||||||||||||||||||||||||||||||||||||||||||||||||||||||||||||||||
| Energy goods | 518 546 | 10.1 | 50 524 | 10.3 | -10.5 | ||||||||||||||||||||||||||||||||||||||||||||||||||||||||||||||||||||||||||
| 1 | NOK million. |
Interpretation of seasonally-adjusted figuresIn order to facilitate the interpretation of the short-term development, Statistics on turnover publishes three-month moving averages of the seasonally-adjusted figures. We normally compare the latest non-overlapping three-month periods (for instance July to September compared with April to June). Seasonally-adjusted changes from one month to another must be interpreted with caution. |
The relationship between production and turnoverThe development in the turnover can be related to changes in both volume and prices in the different industries. Production to stocks and sales from stocks can also happen. Reporting during large deliveries of capital goods can contribute to differences in the development in the index of production and the statistics on turnover. |
Tables
Find more figures
Find detailed figures from Turnover in oil and gas, manufacturing, mining and electricity supply
Additional information
The variation in manufacturing turnover can be related to changes in volume and price indices in different industries and also production to stocks and sales from stocks.
Contact
-
Robert Skotvold
E-mail: robert.skotvold@ssb.no
tel.: (+47) 40 90 24 44
-
Anne Karin Linderud Haugen
E-mail: anne.karin.linderud.haugen@ssb.no
tel.: (+47) 91 88 19 76