Content
Published:
This is an archived release.
Unchanged manufacturing turnover
Seasonally adjusted figures show a slight decrease of 0.8 per cent in turnover in Norwegian manufacturing from the fourth quarter of 2009 to the first quarter of 2010.
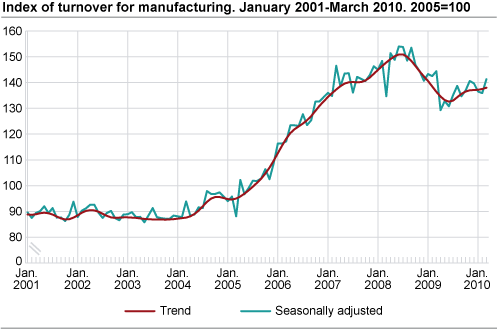
The turnover in Norwegian manufacturing fell by 4.8 per cent within the domestic market, while increasing by 2.8 per cent in the export market according to seasonally adjusted figures. The industries that contributed to this decline in the first quarter of 2010 were repair, installation of machinery and machinery and equipment, which reduced the turnover by 16.8 and 8.2 per cent respectively. Turnover of food products also showed a decline in turnover of 2.8 per cent, while dropping 5.5 per cent in the domestic market.
On the other hand, industries with increased turnover included refined petroleum, chemicals and pharmaceuticals, up by 9.2 per cent, with an increase within the export market of 14.7 per cent. Basic metals reported an 8.5 per cent increase. A boost in production volume is one of the factors that explains this tendency in the first quarter of 2010, (see the index of production ).
Growth in turnover from February to March
The turnover in Norwegian manufacturing went up by 3.9 per cent from February to March 2010, according to seasonally adjusted figures. This was mainly due to a growth of 11.2 and 10.8 per cent respectively within building of ships, boats and oil platforms and refined petroleum, chemicals and pharmaceuticals. Others industries that also reported growth were basic metals and fabricated metal products, with a growth of 2.8 and 15.9 per cent respectively. For this first grouping, an increase in both price and volume was the major reason behind this positive output, (see producer price index ).
Unchanged turnover March 2008 compared to March 2009
Unadjusted figures showed that total turnover in March 2010 compared to March 2009 was unchanged. Refined petroleum, chemicals and pharmaceuticals and basic metals showed strong results. Turnover within these industries rose by 33.9 and 32.6 per cent respectively.
Conversely, industries that showed a decline in turnover were machinery and equipment and building of ships, boats and oil platforms. Turnover within these industries fell by 31.2 and 16.8 per cent respectively.
Norway and the Euro area
Unadjusted figures show that there was a 4.6 per cent fall in Norwegian manufacturing turnover from February 2009 to February 2010. Manufacturing turnover in the Euro area dropped 6.4 per cent in the same period, according to figures published by Eurostat .
| Original series.1
January-March 2010 |
Changes in per cent. January-February 2009- January-February 2010 |
Original series.1
March 2010 |
Changes in per cent. March 2009-March 2010 |
Changes in per cent. Seasonally adjusted. Oktober 2009-Desember 2009- January 2010-March 2010 |
|||||||||||||||||||||||||||||||||||||||||||||||||||||||||||||||||||||||||||
|---|---|---|---|---|---|---|---|---|---|---|---|---|---|---|---|---|---|---|---|---|---|---|---|---|---|---|---|---|---|---|---|---|---|---|---|---|---|---|---|---|---|---|---|---|---|---|---|---|---|---|---|---|---|---|---|---|---|---|---|---|---|---|---|---|---|---|---|---|---|---|---|---|---|---|---|---|---|---|---|
| The overall turnover | 378 397 | 1.9 | 138 035 | 7.4 | 5.2 | ||||||||||||||||||||||||||||||||||||||||||||||||||||||||||||||||||||||||||
| Extraction and related services | 142 507 | -1.5 | 49 694 | 4.0 | 2.5 | ||||||||||||||||||||||||||||||||||||||||||||||||||||||||||||||||||||||||||
| Manufacturing, mining and quarrying | 186 536 | -3.2 | 71 606 | 0.6 | -1.0 | ||||||||||||||||||||||||||||||||||||||||||||||||||||||||||||||||||||||||||
| Domestic market | 114 496 | -7.0 | 45 655 | -1.0 | -4.9 | ||||||||||||||||||||||||||||||||||||||||||||||||||||||||||||||||||||||||||
| Export market | 72 039 | 3.4 | 25 951 | 3.5 | 2.8 | ||||||||||||||||||||||||||||||||||||||||||||||||||||||||||||||||||||||||||
| Electricity, Gas and Steam Supply | 49 354 | 46.3 | 16 735 | 75.2 | 69.4 | ||||||||||||||||||||||||||||||||||||||||||||||||||||||||||||||||||||||||||
| Main industrial groupings | |||||||||||||||||||||||||||||||||||||||||||||||||||||||||||||||||||||||||||||||
| Intermediate goods | 75 091 | 1.6 | 28 181 | 9.5 | -1.1 | ||||||||||||||||||||||||||||||||||||||||||||||||||||||||||||||||||||||||||
| Capital goods | 59 610 | -16.0 | 23 526 | -18.2 | -2.0 | ||||||||||||||||||||||||||||||||||||||||||||||||||||||||||||||||||||||||||
| Consumer goods | 48 674 | 0.2 | 18 466 | 7.4 | -0.7 | ||||||||||||||||||||||||||||||||||||||||||||||||||||||||||||||||||||||||||
| Energy goods | 195 021 | 9.7 | 67 863 | 19.4 | 12.8 | ||||||||||||||||||||||||||||||||||||||||||||||||||||||||||||||||||||||||||
| 1 | NOK million. |
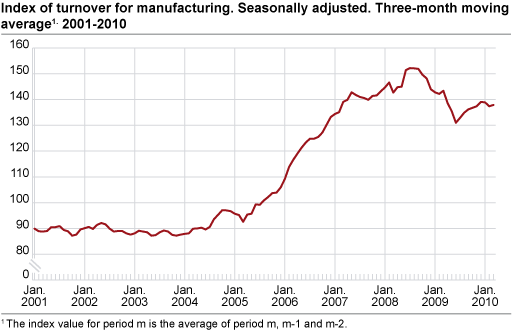
Seasonally adjusted three-month moving averageThe seasonally adjusted three-month moving average for all series is now available in StatBank. Three-month moving average is used to minimise the effect of random variation in monthly figures in order to give a better description of current economic trends. The three-month moving average index number is the average of the three previous monthly index numbers.
For example: three-month moving average for February is the average monthly index numbers for February, January and December. |
Tables
Find more figures
Find detailed figures from Turnover in oil and gas, manufacturing, mining and electricity supply
Additional information
The variation in manufacturing turnover can be related to changes in volume and price indices in different industries and also production to stocks and sales from stocks.
Contact
-
Robert Skotvold
E-mail: robert.skotvold@ssb.no
tel.: (+47) 40 90 24 44
-
Anne Karin Linderud Haugen
E-mail: anne.karin.linderud.haugen@ssb.no
tel.: (+47) 91 88 19 76