Content
Published:
This is an archived release.
Manufacturing turnover increases
The turnover in Norwegian manufacturing went up by 3.1 per cent in the period from August to October 2009 compared to the previous three-month period, according to seasonally-adjusted figures. The turnover increased both in the home and export market.
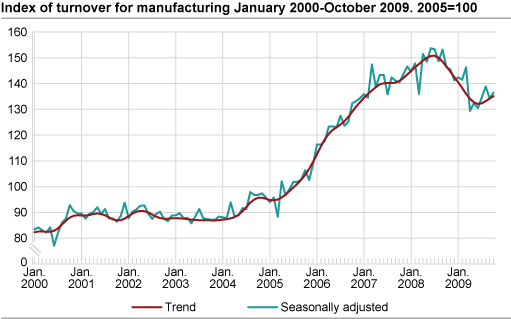
Seasonally-adjusted figures show that the industry related to basic metals increased its turnover by 20.4 per cent. The turnover for non-ferrous metals increased by 21 per cent and was thereby the strongest contributor to the last three-month results. The same applied to refined petroleum, chemicals and pharmaceuticals - up 7.2 per cent. Positive results within these industries are partially due to a combination of an increase in production volume ( Index of production ) and higher producer prices ( Producer price index ). Among the industrial groupings that reduced their industrial turnover in this period were fabricated metal products by 2.4 per cent and building ships, boats and plattforms by 1.2 per cent.
Increase in turnover from September to October 2009
Manufacturing turnover went up by 1.7 per cent from September to October 2009 according to seasonally-adjusted figures. This can be partially explained by substantial deliveries within the building ships, boats and platforms industry, which has increased its turnover by 7.2 per cent in the last month. Other important contributors were repair and installation of machinery and basic metals - up 6.6 and 1.1 per cent respectively.
Lower turnover in October 2009 compared to October 2008
Manufacturing turnover fell by 8.8 per cent in October 2009 compared to October 2008, according to unadjusted figures. The industrial groupings that showed the lowest results were basic metals down 26.1 per cent, and refined petroleum, chemicals and pharmaceuticals by 12.3 per cent. In addition, building ships, boats and plattforms decreased 6.8 per cent and computer and electrical equipment by 19.2 per cent. The decrease within building ships, boats and plattforms can be explained almost entirely by a fall in turnover within the export market.
Turnover of food products remained basically unchanged compared to the previous period.
Norway and the Euro area
Unadjusted figures show that there was a 10.5 per cent fall in Norwegian manufacturing turnover from September 2008 to September 2009. Manufacturing turnover in the Euro area dropped 16.8 per cent in the same period, according to figures published by Eurostat .
|
Original series.1 January-October 2009 |
Changes in per cent.
January-October 2008- January-October 2009 |
Original series.1 October 2009 |
Changes in per cent.
October 2008- October 2009 |
Changes in per cent.
Seasonally adjusted. May 2009-July 2009- August 2009-October 2009 |
|||||||||||||||||||||||||||||||||||
|---|---|---|---|---|---|---|---|---|---|---|---|---|---|---|---|---|---|---|---|---|---|---|---|---|---|---|---|---|---|---|---|---|---|---|---|---|---|---|---|
| The overall turnover | 1 158 436 | -15.1 | 122 973 | -14.0 | 1.6 | ||||||||||||||||||||||||||||||||||
| Extraction and related services | 438 394 | -23.5 | 44 346 | -17.2 | 1.0 | ||||||||||||||||||||||||||||||||||
| Manufacturing, mining and quarrying | 635 646 | -8.7 | 69 682 | -9.0 | 3.2 | ||||||||||||||||||||||||||||||||||
| Domestic market | 410 183 | -2.2 | 45 056 | -4.9 | 2.5 | ||||||||||||||||||||||||||||||||||
| Export market | 225 462 | -18.4 | 24 626 | -15.7 | 1.0 | ||||||||||||||||||||||||||||||||||
| Electricity, Gas and Steam Supply | 84 396 | -12.1 | 8 945 | -30.7 | -16.2 | ||||||||||||||||||||||||||||||||||
| Main industrial groupings | |||||||||||||||||||||||||||||||||||||||
| Intermediate goods | 254 263 | -10.2 | 27 711 | -10.3 | 3.6 | ||||||||||||||||||||||||||||||||||
| Capital goods | 215 051 | 3.8 | 21 789 | -4.4 | 1.9 | ||||||||||||||||||||||||||||||||||
| Consumer goods | 163 601 | 0.3 | 19 123 | -5.2 | 1.0 | ||||||||||||||||||||||||||||||||||
| Energy goods | 525 520 | -26.1 | 54 350 | -21.4 | -0.7 | ||||||||||||||||||||||||||||||||||
| 1 | NOK million. |
Documentation on seasonal adjustmentStatistics Norway has developed general and survey specific documentation on seasonal adjustment practices. The documentation is based on the European Statistical System (ESS): Guidelines on seasonal adjustment . This documentation clarifies the seasonal adjustment practices in use in Statistics Norway, and simplifies a comparison between surveys. Different quality measures are also published in the survey specific documentation. The survey specific documentation is available in the left margin under About seasonal adjustment . The general documentation is available under: http://www.ssb.no/english/metadata/methods/seasonal_adjustment.pdf |
Find more figures
Find detailed figures from Turnover in oil and gas, manufacturing, mining and electricity supply
Additional information
The variation in manufacturing turnover can be related to changes in volume and price indices in different industries and also production to stocks and sales from stocks.
Contact
-
Robert Skotvold
E-mail: robert.skotvold@ssb.no
tel.: (+47) 40 90 24 44
-
Anne Karin Linderud Haugen
E-mail: anne.karin.linderud.haugen@ssb.no
tel.: (+47) 91 88 19 76