Content
Published:
This is an archived release.
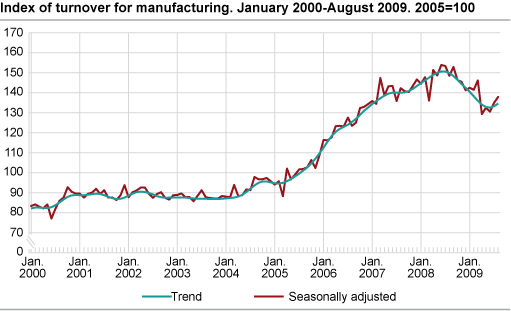
Moderate fall in manufacturing turnover
The turnover in Norwegian manufacturing fell by 1.1 per cent in the period from June to August 2009 compared to the previous three-month period, according to seasonally-adjusted figures.
Seasonally-adjusted figures show yet another fall for the industry related to building ships, boats and oil platforms, this time down 20 per cent. Reduced turnover of 14 per cent in the home market and 22 per cent in the export market can partially explain the result. The lower order reserve for this industrial grouping may contribute to even further fall the upcoming time ( Statistics of new orders ). Computer and electrical equipment and Repair and installation of machinery also experienced a fall in turnover, of 5.6 and 7.6 per cent respectively in this last three-month period. The development in these groups has been highly influenced by lower production volume ( Index of production ). In addition, Machinery and equipment went down by 2.4 per cent.
Among those industrial groupings that had positive results, were basic metals and fabricated metal products - up14 and 4.1 per cent respectively. Turnover increased also for non-metallic mineral products, with 6.0 per cent, wood and wood products, with 7.0 per cent, and within and paper and paper products, with 3.9 per cent.
Increase in turnover from July to August
Manufacturing turnover went up 2.2 per cent from July to August 2009, according to seasonally-adjusted figures. This positive development is partly due to an increase of 24 per cent in turnover within basic metals, of which non-ferrous metals was the major contributor, with a turnover of 27 per cent. This development is due to both a higher demand within the export market and a higher price in the international marked ( Producer price index ). Refined petroleum, chemicals and pharmaceuticals went up by 9.2 per cent and wood and wood products increased by 5.2 per cent.
Lower turnover in August 2009 compared to August 2008
Manufacturing turnover fell by 9.4 per cent in August 2009 compared to August 2008, according to unadjusted figures. Even though turnover figures have shown a better result this last month for industrial groupings such as basic metals, there is still a decrease in turnover in a year to year perspective. Turnover for basic metals has shown a fall of 24 per cent since august last year. The same applies to Refined petroleum, chemicals and pharmaceuticals, down 25 per cent. A negative price development has had a significant influence on these industrial groupings ( Producer price index ). Paper and paper products has also had a drop in turnover, of 17 per cent, while wood and wood products has decreased by 11 per cent.
Among the industries that buffered the fall were food products, up 11 per cent, and fabricated metal products, with an increased turnover of 12 per cent. Machinery and equipment also had an increased turnover, of 13 per cent.
Norway and the euro area
Unadjusted figures show that there was a 12.7 per cent fall in Norwegian manufacturing turnover from July 2008 to July 2009. Manufacturing turnover in the euro area dropped 20.3 per cent in the same period, according to figures published by Eurostat .
|
Original series.1 January-August 2009 |
Changes in per cent.
January-August 2008- January-August 2009 |
Original series.1 August 2009 |
Changes in per cent.
August 2008-August 2009 |
Changes in per cent.
Seasonally adjusted. Mars 2009-mai 2009- Juni 2009-August 2009 |
|||||||||||||||||||||||||||||||||||
|---|---|---|---|---|---|---|---|---|---|---|---|---|---|---|---|---|---|---|---|---|---|---|---|---|---|---|---|---|---|---|---|---|---|---|---|---|---|---|---|
| The overall turnover | 919 859 | -15.0 | 110 733 | -19.1 | 0.1 | ||||||||||||||||||||||||||||||||||
| Extraction and related services | 354 573 | -24.6 | 43 118 | -28.6 | 2.9 | ||||||||||||||||||||||||||||||||||
| Manufacturing, mining and quarrying | 495 778 | -8.3 | 61 442 | -9.2 | -1.1 | ||||||||||||||||||||||||||||||||||
| Domestic market | 318 901 | -1.7 | 41 420 | -2.6 | -0.8 | ||||||||||||||||||||||||||||||||||
| Export market | 176 876 | -18.3 | 20 022 | -20.3 | 3.7 | ||||||||||||||||||||||||||||||||||
| Electricity, Gas and Steam Supply | 69 509 | -2.8 | 6 173 | -30.5 | -6.8 | ||||||||||||||||||||||||||||||||||
| Main industrial groupings | |||||||||||||||||||||||||||||||||||||||
| Intermediate goods | 197 706 | -10.3 | 25 711 | -8.1 | 4.4 | ||||||||||||||||||||||||||||||||||
| Capital goods | 170 652 | 7.5 | 18 511 | -4.9 | -10.4 | ||||||||||||||||||||||||||||||||||
| Consumer goods | 126 321 | 1.6 | 15 700 | 2.5 | 2.2 | ||||||||||||||||||||||||||||||||||
| Energy goods | 425 179 | -26.5 | 50 811 | -31.5 | 0.9 | ||||||||||||||||||||||||||||||||||
| 1 | NOK million. |
Documentation on seasonal adjustmentStatistics Norway has developed general and survey specific documentation of seasonal adjustment practices. The documentation is based on the European Statistical System (ESS): Guidelines on seasonal adjustment . This documentation clarifies the seasonal adjustment practices in use in Statistics Norway, and simplifies a comparison between surveys. Different quality measures are also published in the survey specific documentation. The survey specific documentation is available in the left margin under About seasonal adjustment . The general documentation is available under: http://www.ssb.no/english/metadata/methods/seasonal_adjustment.pdf |
Find more figures
Find detailed figures from Turnover in oil and gas, manufacturing, mining and electricity supply
Additional information
The variation in manufacturing turnover can be related to changes in volume and price indices in different industries and also production to stocks and sales from stocks.
Contact
-
Robert Skotvold
E-mail: robert.skotvold@ssb.no
tel.: (+47) 40 90 24 44
-
Anne Karin Linderud Haugen
E-mail: anne.karin.linderud.haugen@ssb.no
tel.: (+47) 91 88 19 76