Content
Published:
This is an archived release.
Fall in manufacturing turnover
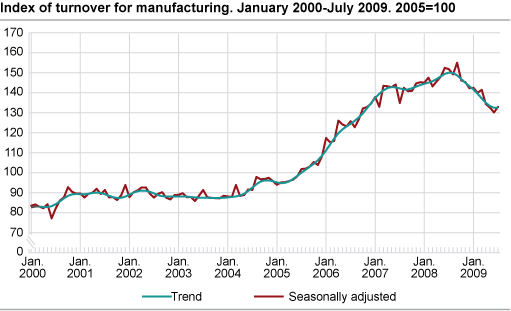
The turnover in Norwegian manufacturing fell by 4.8 per cent in the period from May to July 2009 compared to the previous three-month period, according to seasonally-adjusted figures. The turnover dropped, both in the domestic and in the export market.
Building ships, boats and oil platforms continued decrease
Seasonally-adjusted figures show that the industry related to building ships, boats and oil platforms had the largest decrease in turnover in this last three-month period, down 23.0 per cent. Turnover in the export market dropped 43.8 per cent for this group. Computer and electrical equipment also experienced a reduced turnover by almost 10 per cent. Machinery and equipment and repair and installation of machinery had a fall of 8.4 and 8.2 per cent respectively. A combination of lower demand as well as a reduced order reserve are factors that explained the negative development of these industrial groupings ( Statistics of new orders and Index of production ).
In the opposite direction are fabricated metal products and wood and wood products. Turnover went up 5.8 and 3.9 respectively. There was also a positive result within paper and paper products by 1.6 per cent.
Increase in turnover from June to July
Manufacturing turnover went up 2.1 per cent from June to July 2009, according to seasonally-adjusted figures. This positive development is partly due to an increase in turnover within fabricated metal products and food products by 16.9 and 3.2 respectively.
Lower turnover in July 2009 compared to July 2008
Manufacturing turnover fell by 13.4 per cent in July 2009 compared to July 2008, according to unadjusted figures. The industries that showed the lowest result were basic metals by 39.5 per cent and refined petroleum, chemicals and pharmaceuticals by 37.6 per cent. A negative price development for this groups’ markets has contributed strongly to these results ( Producer price index ). There was also a drop in turnover for the industry related to building ships, boats and oil platforms by 23.7 per cent and for computer and electrical equipment by 17.4 per cent.
Among the industries that buffered the fall were food products by 11.6 per cent and fabricated metal products with an increased turnover of 36.6 per cent. Machinery and equipment also had an increased turnover by 10.9 per cent.
Norway and the euro area
Unadjusted figures show that there was an 11.7 per cent fall in Norwegian manufacturing turnover from June 2008 to June 2009. Manufacturing turnover in the euro area dropped 20.3 per cent in the same period, according to figures published by Eurostat .
|
Original series.1 January-July 2009 |
Changes in per cent.
January-July 2008- January-July 2009 |
Original series.1 Juli 2009 |
Changes in per cent.
July 2008-July 2009 |
Changes in per cent.
Seasonally adjusted. February 2008-April 2009- May 2009-July 2009 |
|||||||||||||||||||||||||||||||||||
|---|---|---|---|---|---|---|---|---|---|---|---|---|---|---|---|---|---|---|---|---|---|---|---|---|---|---|---|---|---|---|---|---|---|---|---|---|---|---|---|
| The overall turnover | 808 378 | -14.5 | 106 487 | -18.6 | -4.8 | ||||||||||||||||||||||||||||||||||
| Extraction and related services | 311 455 | -24.0 | 44 931 | -25.1 | -4.0 | ||||||||||||||||||||||||||||||||||
| Manufacturing, mining and quarrying | 433 589 | -8.3 | 54 650 | -13.6 | -4.8 | ||||||||||||||||||||||||||||||||||
| Domestic market | 276 733 | -1.8 | 32 217 | -8.1 | -5.2 | ||||||||||||||||||||||||||||||||||
| Export market | 156 854 | -18.0 | 22 433 | -20.4 | -5.5 | ||||||||||||||||||||||||||||||||||
| Electricity, Gas and Steam Supply | 63 336 | 1.1 | 6 906 | -8.2 | -6.6 | ||||||||||||||||||||||||||||||||||
| Main industrial groupings | |||||||||||||||||||||||||||||||||||||||
| Intermediate goods | 171 743 | -10.7 | 22 222 | -9.9 | -0.9 | ||||||||||||||||||||||||||||||||||
| Capital goods | 151 803 | 8.9 | 17 331 | -4.6 | -12.1 | ||||||||||||||||||||||||||||||||||
| Consumer goods | 110 463 | 1.3 | 14 819 | 2.8 | 1.1 | ||||||||||||||||||||||||||||||||||
| Energy goods | 374 368 | -25.8 | 52 115 | -29.1 | -5.9 | ||||||||||||||||||||||||||||||||||
| 1 | NOK million. |
Re-calculated figures for January to June 2009The figures for January to June 2009 are re-calculated because of an error in technical calculations. New results are available in the StatBank. The correction influences the distribution of the domestic and export industrial turnover. |
Documentation on seasonal adjustmentStatistics Norway has developed general and survey specific documentation of seasonal adjustment practices. The documentation is based on the European Statistical System (ESS): Guidelines on seasonal adjustment . This documentation clarifies the seasonal adjustment practices in use in Statistics Norway, and simplifies a comparison between surveys. Different quality measures are also published in the survey specific documentation. The survey specific documentation is available in the left margin under About seasonal adjustment . The general documentation is available under: http://www.ssb.no/english/metadata/methods/seasonal_adjustment.pdf |
Find more figures
Find detailed figures from Turnover in oil and gas, manufacturing, mining and electricity supply
Additional information
The variation in manufacturing turnover can be related to changes in volume and price indices in different industries and also production to stocks and sales from stocks.
Contact
-
Robert Skotvold
E-mail: robert.skotvold@ssb.no
tel.: (+47) 40 90 24 44
-
Anne Karin Linderud Haugen
E-mail: anne.karin.linderud.haugen@ssb.no
tel.: (+47) 91 88 19 76