Content
Published:
This is an archived release.
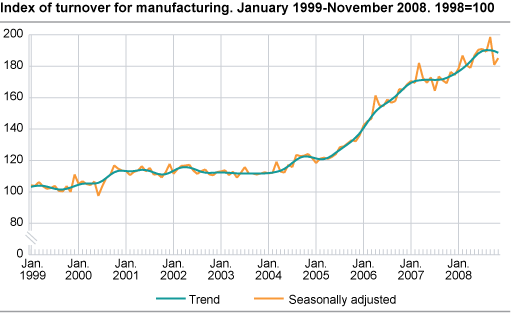
Decrease in manufacturing turnover
Seasonally adjusted figures show a 1.1 decrease in turnover for Norwegian manufacturing in the period from September to November 2008 compared to the previous three-month period.
Total turnover fell by 0.3 per cent in the domestic market and 5.1 per cent in the export market. The fall in total turnover is partly a result of a decrease in volume (see Index of Production ). A substantial fall in the prices of refined petroleum products and basic metals also contributed to the reduction in total turnover (see Producer price index ).
High turnover for producers of capital goods
Seasonally adjusted figures show that the turnover of capital goods increased by 6.3 per cent from September to November 2008 compared to the previous three-month period. Turnover increased by 2.2 per cent in the domestic market and 16.5 per cent in the export market. The main contributor to this development was machinery and equipment.
The turnover of intermediate goods rose by 0.3 per cent in the same period. Turnover in the domestic market grew by 1.1 per cent, while export turnover fell by 1.6 per cent. Wood processing made the greatest contribution to the increase in turnover of intermediate goods. The upturn in wood processing is partly due to higher prices.
Consumer goods turnover grew by 3.3 per cent in the period. The turnover rose by 2.3 per cent in the domestic market and 6.2 per cent in the export market. Food, beverages and tobacco products contributed most to the growth in consumer goods turnover. The positive development can partly be explained by higher prices for this product group.
Turnover increase from October to November 2008
Total turnover increased by 2.3 per cent from October to November 2008. The fall in turnover for the last three-month period compared to the previous months is due to low turnover especially in October, but also in November.
Unchanged turnover compared to November 2007
Unadjusted figures show an increase in total turnover of 0.1 per cent in November 2008 compared to November 2007. Capital goods increased the most by 15.0 per cent. The turnover of intermediate goods decreased by 0.9 per cent, while consumer goods turnover went up by 0.6 per cent.
| Original series.1January-November 2008 | Changes in per cent. January-November 2007-January-November 2008 | Original series.1November 2008 | Changes in per cent. November 2007-November2008 | Changes in per cent. Seasonally adjusted. June 2008-August 2008-September 2008-November 2008 | |||||||||||||||||||||||||||||||||||
|---|---|---|---|---|---|---|---|---|---|---|---|---|---|---|---|---|---|---|---|---|---|---|---|---|---|---|---|---|---|---|---|---|---|---|---|---|---|---|---|
| The overall turnover | 1 529 478 | 16.0 | 133 024 | - | -4.8 | ||||||||||||||||||||||||||||||||||
| Oil and Gas Extraction | 619 354 | 23.7 | 48 525 | -1.4 | -15.3 | ||||||||||||||||||||||||||||||||||
| Manufacturing | 788 442 | 8.1 | 71 420 | 0.1 | -1.1 | ||||||||||||||||||||||||||||||||||
| Hjemmemarked | 479 552 | 8.3 | 45 163 | 6.2 | -0.3 | ||||||||||||||||||||||||||||||||||
| Eksportmarked | 308 890 | 7.9 | 26 257 | -8.9 | -5.1 | ||||||||||||||||||||||||||||||||||
| Electricity, Gas and Steam Supply | 107 468 | 39.0 | 11 813 | 5.2 | 15.5 | ||||||||||||||||||||||||||||||||||
| Main industrial groupings | |||||||||||||||||||||||||||||||||||||||
| Intermediate goods | 289 950 | 4.0 | 26 219 | -0.9 | 0.3 | ||||||||||||||||||||||||||||||||||
| Capital goods | 243 382 | 17.9 | 22 970 | 15.0 | 6.3 | ||||||||||||||||||||||||||||||||||
| Consumer goods | 188 818 | 1.7 | 18 738 | 0.6 | 3.3 | ||||||||||||||||||||||||||||||||||
| Energy goods | 807 331 | 24.7 | 65 097 | -4.2 | -12.2 | ||||||||||||||||||||||||||||||||||
| 1 | NOK million. |
Find more figures
Find detailed figures from Turnover in oil and gas, manufacturing, mining and electricity supply
Additional information
The variation in manufacturing turnover can be related to changes in volume and price indices in different industries and also production to stocks and sales from stocks.
Contact
-
Robert Skotvold
E-mail: robert.skotvold@ssb.no
tel.: (+47) 40 90 24 44
-
Anne Karin Linderud Haugen
E-mail: anne.karin.linderud.haugen@ssb.no
tel.: (+47) 91 88 19 76