Content
Published:
This is an archived release.
Capital goods behind growth in turnover
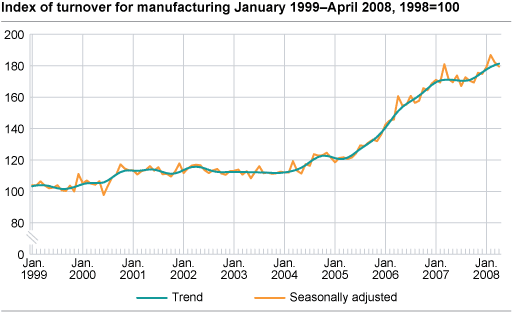
Total turnover in Norwegian manufacturing rose by 3.6 per cent from February to April compared to the previous three-month period. Capital goods had the strongest growth in turnover in this period.
According to seasonally adjusted figures, the total turnover rose by 7.2 per cent in the domestic market and 2.5 per cent in the export market from February to April compared with the previous three-month period. The growth in industrial turnover is related to the positive price development in the Norwegian manufacturing industry. For more information on price developments in the manufacturing industry, see the Producer price index . There has also been an increase in the seasonally adjusted volume by 2.6 per cent according the Index of production .
High turnover for producers of capital goods
Producers of capital goods achieved positive turnover figures from February to April compared with the previous three-month period. Seasonally adjusted figures showed a total increase of 9.4 per cent for this main industrial grouping and 12.5 per cent in the domestic market. The strong results within capital goods were due to good performance in machinery and equipment n.e.c, which rose by 5.9 per cent, transport equipment which rose by 15.9 per cent. The total turnover for oil platforms rose by 20.3 per cent and 22.5 per cent in the domestic market. The latter was mainly due to deliveries of large projects in the domestic market. The same applies to transport equipment, where turnover in the domestic market rose by 23.3 per cent.
The turnover of intermediate goods rose by a modest 1.7 per cent in the same period. Industries with positive results include rubber and plastics products, wood and wood products and other non-metallic mineral products. Refined petroleum products and chemicals and basic metals, on the other hand, experienced a drop in turnover.
The total turnover of consumer goods decreased by 0.9 per cent, mainly due to a 7.0 per cent drop in export turnover of food products, beverages and tobacco.
|
Original series.1 January-April 2008 |
Changes in per cent.
January-April 2007- January-April 2008 |
Original series.1 April 2008 |
Changes in per cent.
April 2007- April 2008 |
Changes in per cent. Seasonally adjusted.
November 2007-January 2008- February 2008-April 2008 |
|||||||||||||||||||||||||||||||||||
|---|---|---|---|---|---|---|---|---|---|---|---|---|---|---|---|---|---|---|---|---|---|---|---|---|---|---|---|---|---|---|---|---|---|---|---|---|---|---|---|
| The overall turnover | 541 508 | 15.1 | 140 879 | 22.1 | 2.6 | ||||||||||||||||||||||||||||||||||
| Oil and Gas Extraction | 223 087 | 23.3 | 57 933 | 22.3 | 6.1 | ||||||||||||||||||||||||||||||||||
| Manufacturing | 274 051 | 6.5 | 73 181 | 20.2 | 3.6 | ||||||||||||||||||||||||||||||||||
| Hjemmemarked | 162 481 | 4.5 | 43 458 | 20.1 | 7.2 | ||||||||||||||||||||||||||||||||||
| Eksportmarked | 111 570 | 9.5 | 29 723 | 20.2 | -2.5 | ||||||||||||||||||||||||||||||||||
| Electricity, Gas and Steam Supply | 40 825 | 42.0 | 8 721 | 41.2 | -12.0 | ||||||||||||||||||||||||||||||||||
| Main industrial groupings | |||||||||||||||||||||||||||||||||||||||
| Intermediate goods | 100 446 | 1.8 | 27 716 | 18.8 | 1.7 | ||||||||||||||||||||||||||||||||||
| Capital goods | 81 600 | 11.0 | 21 944 | 28.8 | 9.4 | ||||||||||||||||||||||||||||||||||
| Consumer goods | 67 433 | 2.5 | 17 878 | 20.5 | -0.9 | ||||||||||||||||||||||||||||||||||
| Energy goods | 292 029 | 25.5 | 73 340 | 22.0 | 2.8 | ||||||||||||||||||||||||||||||||||
| 1 | NOK million. |
Find more figures
Find detailed figures from Turnover in oil and gas, manufacturing, mining and electricity supply
Additional information
The variation in manufacturing turnover can be related to changes in volume and price indices in different industries and also production to stocks and sales from stocks.
Contact
-
Robert Skotvold
E-mail: robert.skotvold@ssb.no
tel.: (+47) 40 90 24 44
-
Anne Karin Linderud Haugen
E-mail: anne.karin.linderud.haugen@ssb.no
tel.: (+47) 91 88 19 76

