Content
Published:
This is an archived release.
Capital goods with strongest increase in turnover
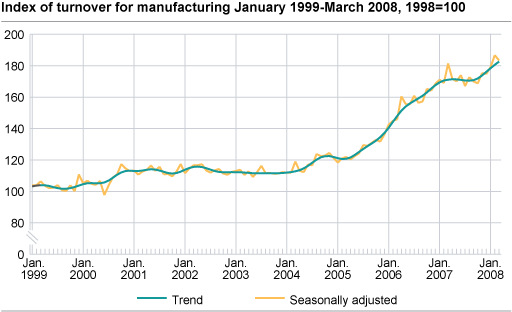
Total turnover in Norwegian manufacturing increased by 5.9 per cent from the last quarter 2007 to the first quarter 2008, according to seasonally adjusted figures. Capital goods showed the strongest growth in this period.
Total turnover rose by 7.2 per cent in the domestic market and 2.0 per cent in the export market according to seasonally adjusted figures. Growth in industrial turnover is related to the positive price development within Norwegian industry. For more information on price developments in the manufacturing industry, see the Producer price index . There has also been an increase in volume by 1.0 per cent according the Index of Production .
All main industrial groupings showed an increase in turnover in the first quarter of 2008 according to seasonally adjusted figures. It was capital goods that took the lead with an increase of 14.4 per cent. The turnover in the domestic marked for this grouping went up by a strong 18.8 per cent.
The positive development in capital goods is attributed to an increase in turnover for industries like machinery and equipment n.e.c, oil platforms and modules and transport equipment. Oil platforms showed a solid increase by 38.1 per cent from last quarter 2007 to first quarter 2008. Machinery and equipment n.e.c went up by 8.0 per cent and transport equipment increased its turnover by 6.8 per cent. This last group had a significant 13.8 per cent increase in turnover within the domestic market, while the export market had a decrease by 10.2 per cent.
The turnover of intermediate goods rose by a modest 0.5 per cent in the same period. The industries that showed positive results were fabricated metal products, other non-metallic mineral products, rubber and plastics products and basic chemicals. Refined petroleum products and chemicals and basic metals had, on the other hand, a drop in their turnover.
The total turnover of consumer goods increased by 1.7 per cent from last quarter 2007 to the first quarter 2008, the main reason being the increased turnover of food products, beverages and tobacco, which rose by 3.1 per cent.
| Original series1. January-March 2008 | Changes in per cent. January-March 2007-January-March 2008 | Original series1. March 2008 | Changes in per cent. March 2007-March 2008 | Changes in per cent. Seasonally adjusted. October-December 2007-Januar 2008-March 2008 | |||||||||||||||||||||||||||||||||||
|---|---|---|---|---|---|---|---|---|---|---|---|---|---|---|---|---|---|---|---|---|---|---|---|---|---|---|---|---|---|---|---|---|---|---|---|---|---|---|---|
| The overall turnover | 401 237 | 13.0 | 133 944 | 4.3 | 5.7 | ||||||||||||||||||||||||||||||||||
| Oil and Gas Extraction | 165 154 | 23.6 | 57 191 | 25.8 | 7.6 | ||||||||||||||||||||||||||||||||||
| Manufacturing | 201 108 | 2.3 | 66 116 | -11.5 | 5.9 | ||||||||||||||||||||||||||||||||||
| Hjemmemarked | 119 217 | -0.1 | 40 624 | -12.9 | 7.2 | ||||||||||||||||||||||||||||||||||
| Eksportmarked | 81 891 | 6.1 | 25 492 | -9.2 | 2.0 | ||||||||||||||||||||||||||||||||||
| Electricity, Gas and Steam Supply | 32 471 | 43.9 | 9 719 | 33.0 | 1.7 | ||||||||||||||||||||||||||||||||||
| Main industrial groupings | |||||||||||||||||||||||||||||||||||||||
| Intermediate goods | 72 759 | -3.4 | 23 507 | -15.6 | 0.5 | ||||||||||||||||||||||||||||||||||
| Capital goods | 59 807 | 5.8 | 20 586 | -13.0 | 14.4 | ||||||||||||||||||||||||||||||||||
| Consumer goods | 49 613 | -2.6 | 15 660 | -13.9 | 1.7 | ||||||||||||||||||||||||||||||||||
| Energy goods | 219 057 | 27.0 | 74 191 | 26.3 | 5.9 | ||||||||||||||||||||||||||||||||||
| 1 | NOK million. |
Find more figures
Find detailed figures from Turnover in oil and gas, manufacturing, mining and electricity supply
Additional information
The variation in manufacturing turnover can be related to changes in volume and price indices in different industries and also production to stocks and sales from stocks.
Contact
-
Robert Skotvold
E-mail: robert.skotvold@ssb.no
tel.: (+47) 40 90 24 44
-
Anne Karin Linderud Haugen
E-mail: anne.karin.linderud.haugen@ssb.no
tel.: (+47) 91 88 19 76

