Content
Published:
This is an archived release.
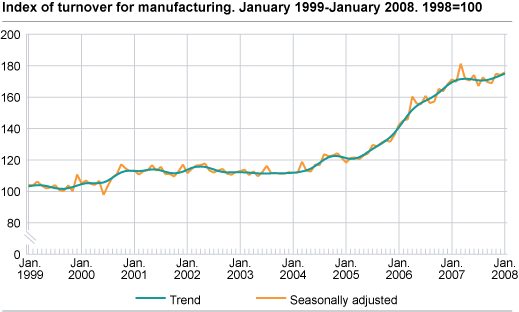
Continued rise in turnover
Seasonally adjusted figures show that total turnover in Norwegian manufacturing increased by 2.7 percent from December 2007 to January 2008 compared with the previous three-month period. Turnover in the export market rose by 10.6 per cent, while turnover in the domestic market fell by 2.0 per cent.
Capital goods turnover increased by 1.5 per cent from November 2007 to January 2008, compared to the previous three-month period. Electrical and optical equipment showed the strongest increase with 7.4 per cent in total. The export market contributed with 21.4 per cent of this growth.
The turnover within intermediate goods rose by 0.9 per cent in the same period. Refined petroleum products and chemical products had the strongest growth with 12.5 per cent. Other groups with positive results were basic metals and rubber and plastic products with an increase of 1.4 and 3.4 per cent respectively.
The turnover within food products, beverages and tobacco rose by 1.8 per cent compared to the previous three-month period. This resulted in a 0.1 per cent increase in the total turnover of consumer goods.
Seasonally adjusted figures show that from December 2007 to January 2008 the total turnover within manufacturing rose by 1.0 per cent. The strongest growth was seen in capital goods with 3.8 per cent.
|
Original series1 January 2008 |
Changes in per cent
January 2007- January 2008 |
Seasonally adjusted
changes in per cent December 2007- January 2008 |
Changes in per cent.
Seasonally adjusted August 2007-October 2007- November 2007-January 2008 |
||||||||||||||||||||||||||||||||||||
|---|---|---|---|---|---|---|---|---|---|---|---|---|---|---|---|---|---|---|---|---|---|---|---|---|---|---|---|---|---|---|---|---|---|---|---|---|---|---|---|
| The overall turnover | 131 505 | 11.2 | -2.1 | 6.2 | |||||||||||||||||||||||||||||||||||
| Oil and Gas Extraction | 53 655 | 12.9 | -4.8 | 8.7 | |||||||||||||||||||||||||||||||||||
| Manufacturing | 64 385 | 4.3 | 1.0 | 2.7 | |||||||||||||||||||||||||||||||||||
| Domestic market | 36 207 | 1.5 | -2.0 | ||||||||||||||||||||||||||||||||||||
| Export market | 28 178 | 10.4 | -3.8 | 10.6 | |||||||||||||||||||||||||||||||||||
| Electricity, Gas and Steam Supply2 | 12 644 | 56.3 | 8.3 | 26.5 | |||||||||||||||||||||||||||||||||||
| Main industrial groupings | |||||||||||||||||||||||||||||||||||||||
| Intermediate goods | 24 354 | 0.5 | 0.8 | 0.9 | |||||||||||||||||||||||||||||||||||
| Capital goods | 17 221 | 2.9 | 3.8 | 1.5 | |||||||||||||||||||||||||||||||||||
| Consumer goods | 16 867 | 2.8 | 1.8 | 0.1 | |||||||||||||||||||||||||||||||||||
| Energy goods | 73 064 | 20.0 | -5.0 | 12.2 | |||||||||||||||||||||||||||||||||||
| 1 | NOK million. |
| 2 |
Turnover in Electricity, Gas and Steam Supply is lower due to a new method for defining the Norwegian region of the
spot market for trading of electrical energy. |
Find more figures
Find detailed figures from Turnover in oil and gas, manufacturing, mining and electricity supply
Additional information
The variation in manufacturing turnover can be related to changes in volume and price indices in different industries and also production to stocks and sales from stocks.
Contact
-
Robert Skotvold
E-mail: robert.skotvold@ssb.no
tel.: (+47) 40 90 24 44
-
Anne Karin Linderud Haugen
E-mail: anne.karin.linderud.haugen@ssb.no
tel.: (+47) 91 88 19 76

