Content
Published:
This is an archived release.
Manufacturing’s turnover levels off
Seasonally adjusted figures show an increase of 4.7 per cent in turnover for Norwegian manufacturing in the period May to July, compared with the previous three months. The domestic marked had a decrease of 7.5 per cent, while the export market increased with 7.6 per cent.
Slight fall for seasonally adjusted numbers
Turnover of capital goods and consumer goods had a slight fall of 3.5 and 1.7 per cent respectively, compared with the previous three-month period. Decrease in domestic markets seams to be the major contributor to this development.
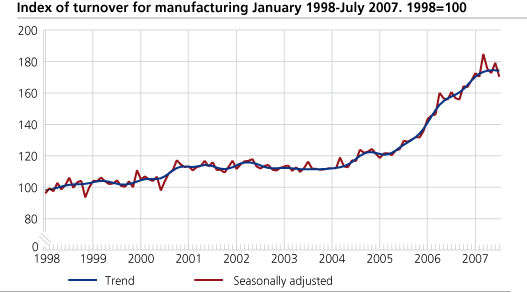
Positive development over last twelve months
Turnover for Norwegian Manufacturing experienced an increase of 8.9 per cent in July 2007 compared to July 2006.The domestic market went up by 3.1 per cent, while export markets rose by 18 per cent contributing the most to the positive result.
| Statistics on turnover of oil and gas extraction, mining and quarrying, manufacturing, electricity and gas supply. July 2007 |
| Original series1January-July 07 | Changes in per cent January-July 06 - January-July 07 | Original series1July 2007 | Changes in per cent July 06 - July 07 | Changes in per cent. Seasonally adjusted. Feb.07 - April.07 - May.07 - July.07 | |||||||||||||||||||||||||||||||||||
|---|---|---|---|---|---|---|---|---|---|---|---|---|---|---|---|---|---|---|---|---|---|---|---|---|---|---|---|---|---|---|---|---|---|---|---|---|---|---|---|
| The overall turnover | 820 361 | -0.2 | 104 973 | -4.2 | 0.2 | ||||||||||||||||||||||||||||||||||
| Oil and Gas Extraction | 310 639 | -6.0 | 43 603 | -10.6 | - | ||||||||||||||||||||||||||||||||||
| Manufacturing | 457 610 | 15.4 | 54 715 | 8.9 | -1.5 | ||||||||||||||||||||||||||||||||||
| Domestic Market | 276 734 | 14.1 | 31 622 | 3.1 | -7.5 | ||||||||||||||||||||||||||||||||||
| Export Market | 180 876 | 17.5 | 23 093 | 18.0 | 7.6 | ||||||||||||||||||||||||||||||||||
| Electricity, Gas and Steam Supply | 45 341 | -48.9 | 5 462 | -42.8 | 0.9 | ||||||||||||||||||||||||||||||||||
| Main industrial groupings | |||||||||||||||||||||||||||||||||||||||
| Intermediate goods | 174 547 | 19.2 | 21 839 | 17.6 | -0.6 | ||||||||||||||||||||||||||||||||||
| Capital goods | 133 972 | 20.6 | 13 894 | 4.5 | -3.5 | ||||||||||||||||||||||||||||||||||
| Consumer goods | 114 453 | 6.8 | 14 376 | 6.1 | -1.7 | ||||||||||||||||||||||||||||||||||
| Energy goods | 397 391 | -13.2 | 54 864 | -14.6 | 1.4 | ||||||||||||||||||||||||||||||||||
| 1 | Million NOK. |
Find more figures
Find detailed figures from Turnover in oil and gas, manufacturing, mining and electricity supply
Additional information
The variation in manufacturing turnover can be related to changes in volume and price indices in different industries and also production to stocks and sales from stocks.
Contact
-
Robert Skotvold
E-mail: robert.skotvold@ssb.no
tel.: (+47) 40 90 24 44
-
Anne Karin Linderud Haugen
E-mail: anne.karin.linderud.haugen@ssb.no
tel.: (+47) 91 88 19 76