Content
Published:
This is an archived release.
Growth in turnover in first half of 2007
Turnover in Norwegian manufacturing amounted to NOK 404 billion in the period January to June 2007, an increase of 17 per cent from the same period in 2006. The domestic and export markets contributed equally to the positive development.
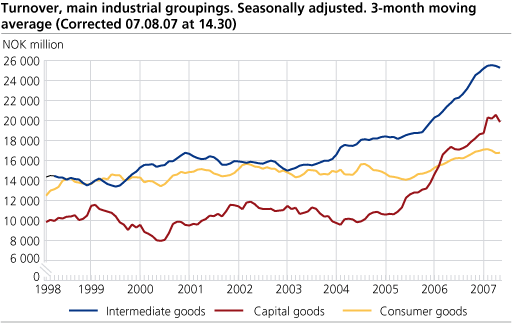
Strongest growth from capital goods
Turnover of capital goods rose by 23.2 per cent in the first half of this year compared with the same period last year. The major contributors to the strong growth come from the high level of activity in machinery and equipment, oil platforms and modules and transport equipment.
Turnover of intermediate goods rose by 19.8 per cent in the first six months of 2007 compared with the same period last year. Manufacture of basic metals, basic chemicals and manufacture of pulp, paper and paper products showed the strongest increase. High prices in the metal market contributed to the growth in turnover of basic metals.
Consumer goods experienced an increase in turnover of 7.4 per cent in the first six months of 2007 compared with the same period in 2006.
Energy goods had a fall in turnover of 13 per cent in the first six months of 2007 compared with the same period last year. Lower production of oil may be behind this decline.
| Statistics on turnover of oil and gas extraction, mining and quarrying, manufacturing, electricity and gas supply. June 2007 |
| Original series1January-June 2007 | Changes in per cent January-June 2006-January-June 2007 | Original series1June 2007 | Changes in per cent June 2006-June 2007 | Changes in per cent. Seasonally adjusted. Jan. 2007-Mar. 2007-April 2007-June 2007 | |||||||||||||||||||||||||||||||||||
|---|---|---|---|---|---|---|---|---|---|---|---|---|---|---|---|---|---|---|---|---|---|---|---|---|---|---|---|---|---|---|---|---|---|---|---|---|---|---|---|
| The overall turnover | 716 372 | 0.5 | 121 062 | -3.2 | 1.6 | ||||||||||||||||||||||||||||||||||
| Oil and Gas Extraction | 267 036 | -5.2 | 39 274 | -18.6 | 1.5 | ||||||||||||||||||||||||||||||||||
| Manufacturing | 403 875 | 16.6 | 75 114 | 13.8 | 0.4 | ||||||||||||||||||||||||||||||||||
| Domestic Market | 246 506 | 16.4 | 45 244 | 9.4 | -4.0 | ||||||||||||||||||||||||||||||||||
| Export Market | 157 369 | 17.1 | 29 870 | 21.3 | 8.3 | ||||||||||||||||||||||||||||||||||
| Electricity, Gas and Steam Supply | 39 826 | -49.8 | 5 570 | -42.7 | -5.9 | ||||||||||||||||||||||||||||||||||
| Main industrial groupings | |||||||||||||||||||||||||||||||||||||||
| Intermediate goods | 153 133 | 19.8 | 27 816 | 13.6 | -0.8 | ||||||||||||||||||||||||||||||||||
| Capital goods | 120 485 | 23.2 | 23 831 | 24.2 | -2.2 | ||||||||||||||||||||||||||||||||||
| Consumer goods | 100 487 | 7.4 | 17 618 | 2.6 | -2.1 | ||||||||||||||||||||||||||||||||||
| Energy goods | 342 270 | -13.0 | 51 797 | -19.3 | 4.6 | ||||||||||||||||||||||||||||||||||
| 1 | NOK million. |
Find more figures
Find detailed figures from Turnover in oil and gas, manufacturing, mining and electricity supply
Additional information
The variation in manufacturing turnover can be related to changes in volume and price indices in different industries and also production to stocks and sales from stocks.
Contact
-
Robert Skotvold
E-mail: robert.skotvold@ssb.no
tel.: (+47) 40 90 24 44
-
Anne Karin Linderud Haugen
E-mail: anne.karin.linderud.haugen@ssb.no
tel.: (+47) 91 88 19 76