Content
Published:
This is an archived release.
Growth in manufacturing
Seasonally adjusted figures show an increase of 4.7 per cent in turnover for Norwegian manufacturing in the period February to April compared with the previous three months. The increase was due to both growth in the domestic and export market, with 9.2 and 0.6 per cent respectively.
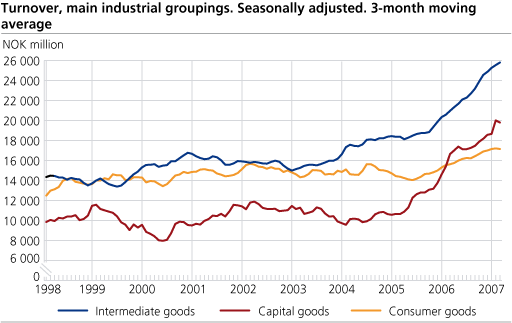
Seasonally adjusted figures show that turnover in all main industrial groupings except energy goods increased in the last three-month period. Capital goods had the strongest growth with an increase of 6.6 per cent, mainly caused by increased turnover in transport equipment, oil platforms and modules. Intermediate goods rose by 3.7 per cent. Turnover in the largest industry within consumer goods, food products, beverage and tobacco, experienced a decline in this period. Consumer goods still had an increase of 0.9 per cent. Energy goods fell by 1.1 per cent, caused by a decline in the domestic market.
Decline in turnover from March to April 2007
Seasonally adjusted figures show that capital goods experienced a decrease of 13.5 per cent in turnover from March to April 2007 after a substantial rise from February to March. The change in energy goods was positive with an increase of 4.0 per cent, mainly caused by upswing in export market. Consumer goods show a decrease in turnover of 1.0 per cent, which was also the case for the last month, whereas intermediate goods experienced a decline of less than 1 per cent.
| Statistics on turnover of oil and gas extraction, mining and quarrying, manufacturing, electricity and gas supply. April 2007 |
| Original series1January-April 07 | Changes in per cent January-April 06 - January-April 07 | Original series1April 2007 | Changes in per cent April 06- April 07 | Changes in per cent. Seasonally adjusted. Nov.06- Jan.07 - Feb.07 - Apr.07 | |||||||||||||||||||||||||||||||||||
|---|---|---|---|---|---|---|---|---|---|---|---|---|---|---|---|---|---|---|---|---|---|---|---|---|---|---|---|---|---|---|---|---|---|---|---|---|---|---|---|
| The overall turnover | 472 958 | 1.2 | 117 614 | -1.9 | 0.8 | ||||||||||||||||||||||||||||||||||
| Oil and Gas Extraction | 180 959 | -2.7 | 47 362 | -3.6 | -1.2 | ||||||||||||||||||||||||||||||||||
| Manufacturing | 259 966 | 18.5 | 63 227 | 11.5 | 4.7 | ||||||||||||||||||||||||||||||||||
| Domestic Market | 158 078 | 20.1 | 38 594 | 8.4 | 9.2 | ||||||||||||||||||||||||||||||||||
| Export Market | 101 888 | 16.1 | 24 663 | 16.7 | 0.6 | ||||||||||||||||||||||||||||||||||
| Electricity, Gas and Steam Supply | 28 539 | -51.4 | 6 072 | -54.1 | -18.1 | ||||||||||||||||||||||||||||||||||
| Main industrial groupings | |||||||||||||||||||||||||||||||||||||||
| Intermediate goods | 99 343 | 23.5 | 24 132 | 22.2 | 3.7 | ||||||||||||||||||||||||||||||||||
| Capital goods | 74 994 | 22.5 | 18 246 | 1.5 | 6.6 | ||||||||||||||||||||||||||||||||||
| Consumer goods | 66 248 | 10.8 | 15 225 | 9.6 | 0.9 | ||||||||||||||||||||||||||||||||||
| Energy goods | 232 374 | -12.6 | 60 011 | -12.0 | -1.1 | ||||||||||||||||||||||||||||||||||
| 1 | Million NOK. |
Find more figures
Find detailed figures from Turnover in oil and gas, manufacturing, mining and electricity supply
Additional information
The variation in manufacturing turnover can be related to changes in volume and price indices in different industries and also production to stocks and sales from stocks.
Contact
-
Robert Skotvold
E-mail: robert.skotvold@ssb.no
tel.: (+47) 40 90 24 44
-
Anne Karin Linderud Haugen
E-mail: anne.karin.linderud.haugen@ssb.no
tel.: (+47) 91 88 19 76