Content
Published:
This is an archived release.
Strong annual turnover in 2006
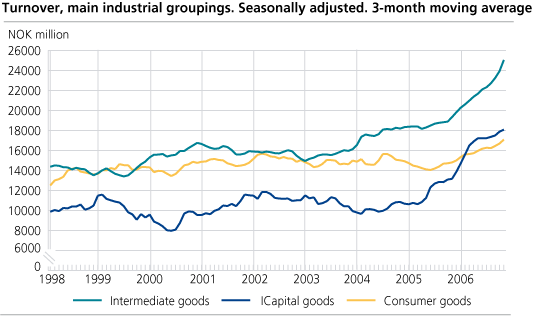
The total turnover within Norwegian manufacturing amounted to NOK 722 billion in 2006. This is an increase of 23.9 per cent from 2005. Turnover within intermediate goods experienced the strongest growth, whereas consumer goods had the weakest growth.
Turnover within intermediate goods increased by 41.9 per cent from 2005 to 2006, and hereby the major contributor to the rise in turnover within Norwegian manufacturing. Especially machinery and equipment n.e.c., oil platforms and transport equipment contribute to this rise. According to seasonally adjusted figures, there was a continuous increase in turnover for oil platforms and transport equipment from 3r d to 4t h quarter in 2006. Machinery and equipment n.e.c., however, experienced a slight decrease of 1.4 per cent within the same period.
Capital goods up 20.6 per cent
The main contributor to the rise in turnover for capital goods is found within manufacturing of basic metals, where for instance non-ferrous metals increased by 42.7 per cent from 2005 to 2006. According to seasonally adjusted figures, all divisions within this particular main industrial grouping experienced increase in turnover from 3r d to 4t h quarter of 2006. Non-ferrous metal is noticeable even here with the largest growth in the same period, with an increase of 18.4 per cent.
Consumer goods up 12.4 per cent
Manufacturing of food products, beverages, tobacco is by far the largest within this main industrial grouping. With an annual turnover of NOK 138 billion in 2006, this gives an increase of 17 per cent from 2005. Seasonally adjusted figures show an increase of 3.9 per cent from 3r d to 4t h quarter for food products, beverages, tobacco.
Even durable consumer goods experienced a rise in turnover. Durable consumer goods increased by 7.5 per cent from 2005 to 2006. Furthermore, the seasonally adjusted figures show an increase of 3.8 per cent from 3r d. to 4t h quarter of 2006.
Major increase in turnover for Norwegian oil and gas extraction
Turnover within Norwegian oil and gas extraction amounted to just below NOK 550 billion in 2006, an increase of 18.1 per cent from 2005. A decrease, however, is obvious from 3r d to 4t h quarter of 2006, which was mainly due to the fall in the prices on crude oil in the 4t h quarter of 2006. Although prices on crude oil still kept a higher level than the 4t h quarter of 2005, prices achieved in both the 2n d and 3r d quarter of 2006 contribute to most of the growth in 2006 as a whole. For more information on prices on crude oil, please continue to External trade figures .
| Statistics on turnover of oil and gas extraction, mining and quarrying, manufacturing, electricity and gas supply. December 2006 |
| Original series1January-December 2006 | Changes in per cent January-December 2005-January-December 2006 | Original series1December 2006 | Changes in per cent December 2005-December 2006 | Changes in per cent. Seasonally adjusted July 2006 -September 2006-October 2006-December 2006 | |||||||||||||||||||||||||||||||||||
|---|---|---|---|---|---|---|---|---|---|---|---|---|---|---|---|---|---|---|---|---|---|---|---|---|---|---|---|---|---|---|---|---|---|---|---|---|---|---|---|
| The overall turnover | 1 419 950 | 20.5 | 116 490 | 3.3 | -1.9 | ||||||||||||||||||||||||||||||||||
| Oil and Gas Extraction | 549 991 | 18.1 | 43 039 | -5.4 | -4.9 | ||||||||||||||||||||||||||||||||||
| Manufacturing | 722 192 | 23.9 | 64 613 | 24.3 | 5.8 | ||||||||||||||||||||||||||||||||||
| Hjemmemarked | 443 499 | 26.5 | 41 802 | 32.2 | 7.3 | ||||||||||||||||||||||||||||||||||
| Eksportmarked | 278 693 | 20.0 | 22 811 | 12.0 | 2.1 | ||||||||||||||||||||||||||||||||||
| Electricity, Gas and Steam Supply | 136 157 | 14.9 | 8 012 | -44.5 | -29.3 | ||||||||||||||||||||||||||||||||||
| Main industrial groupings | |||||||||||||||||||||||||||||||||||||||
| Intermediate goods | 269 933 | 20.6 | 23 969 | 30.3 | 10.3 | ||||||||||||||||||||||||||||||||||
| Capital goods | 204 663 | 41.9 | 19 944 | 31.9 | 4.1 | ||||||||||||||||||||||||||||||||||
| Consumer goods | 194 620 | 12.4 | 16 574 | 14.5 | 5.2 | ||||||||||||||||||||||||||||||||||
| Energy goods | 750 733 | 17.9 | 56 003 | -13.6 | -10.1 | ||||||||||||||||||||||||||||||||||
| 1 | Million NOK. |
Find more figures
Find detailed figures from Turnover in oil and gas, manufacturing, mining and electricity supply
Additional information
The variation in manufacturing turnover can be related to changes in volume and price indices in different industries and also production to stocks and sales from stocks.
Contact
-
Robert Skotvold
E-mail: robert.skotvold@ssb.no
tel.: (+47) 40 90 24 44
-
Anne Karin Linderud Haugen
E-mail: anne.karin.linderud.haugen@ssb.no
tel.: (+47) 91 88 19 76

