Content
Published:
This is an archived release.
Growth in manufacturing turnover
Total turnover in Norwegian manufacturing amounted to approximately NOK 591 billion from January to October 2006, an increase of 24 per cent compared to the same period last year. Total turnover in October this year was 27.6 per cent higher than October last year.
Turnover within Norwegian oil and gas extraction amounted to nearly NOK 46 billion in October 2006, and went up by 3.1 per cent compared with same period last year. The price on crude oil (Brent blend) in October was NOK 387 compared to NOK 382 in October last year, according to External trade figures .
Strongest growth within intermediate goods
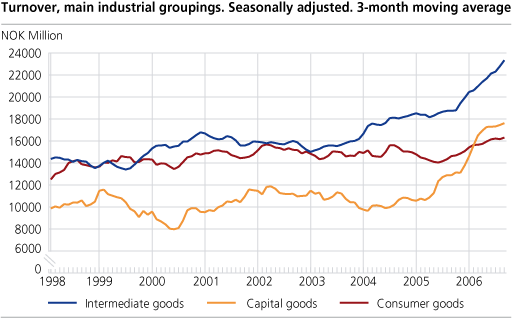
Compared to the previous three-month period, seasonally adjusted figures show an increase in turnover for intermediate goods, capital goods and consumer goods in the period from August to October this year. The increase within intermediate goods and capital goods are mainly due to an increase in the export market. For capital goods there was an increase in export, whereas the turnover in the domestic market experienced a slight decrease.
| Statistics on turnover of oil and gas extraction, mining and quarrying, manufacturing, electricity and gas supply. October 2006 |
| Original series1January - October 06 | Changes in per cent January - October 05 - January - October 06 | Original series1October 2006 | Changes in per cent October 05 - October 06 | Changes in per cent. Seasonally adjusted May 06 - July 06 - August 06 - October 06 | |||||||||||||||||||||||||||||||||||
|---|---|---|---|---|---|---|---|---|---|---|---|---|---|---|---|---|---|---|---|---|---|---|---|---|---|---|---|---|---|---|---|---|---|---|---|---|---|---|---|
| The overall turnover | 1 181 763 | 23.1 | 125 373 | 14.0 | -4.6 | ||||||||||||||||||||||||||||||||||
| Oil and Gas Extraction | 463 136 | 21.4 | 45 961 | 3.1 | -11.0 | ||||||||||||||||||||||||||||||||||
| Manufacturing | 590 814 | 24.0 | 68 742 | 27.6 | 0.2 | ||||||||||||||||||||||||||||||||||
| Hjemmemarked | 361 886 | 27.1 | 42 151 | 34.1 | -1.5 | ||||||||||||||||||||||||||||||||||
| Eksportmarked | 228 928 | 19.4 | 26 591 | 18.5 | 2.9 | ||||||||||||||||||||||||||||||||||
| Electricity, Gas and Steam Supply | 117 947 | 27.1 | 9 571 | -8.6 | -4.6 | ||||||||||||||||||||||||||||||||||
| Main industrial groupings | |||||||||||||||||||||||||||||||||||||||
| Intermediate goods | 221 263 | 19.3 | 26 438 | 33.2 | 5.4 | ||||||||||||||||||||||||||||||||||
| Capital goods | 165 466 | 44.1 | 19 908 | 45.4 | 1.9 | ||||||||||||||||||||||||||||||||||
| Consumer goods | 158 975 | 11.8 | 18 725 | 16.2 | 1.0 | ||||||||||||||||||||||||||||||||||
| Energy goods | 636 057 | 22.9 | 60 302 | - | -12.1 | ||||||||||||||||||||||||||||||||||
| 1 | NOK million. |
Find more figures
Find detailed figures from Turnover in oil and gas, manufacturing, mining and electricity supply
Additional information
The variation in manufacturing turnover can be related to changes in volume and price indices in different industries and also production to stocks and sales from stocks.
Contact
-
Robert Skotvold
E-mail: robert.skotvold@ssb.no
tel.: (+47) 40 90 24 44
-
Anne Karin Linderud Haugen
E-mail: anne.karin.linderud.haugen@ssb.no
tel.: (+47) 91 88 19 76

