Content
Published:
This is an archived release.
Increased turnover
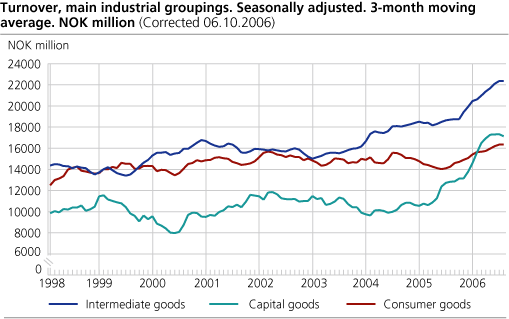
Total turnover in Norwegian manufacturing amounted to almost NOK 179 billion in the period June to August, a 24.7 per cent increase from the same period in 2005. All the main industrial groupings experienced positive growth and were most pronounced within capital goods.
Turnover in Norwegian oil and gas extraction amounted to approximately NOK 45 billion in August, an increase of 12.2 per cent compared with August last year. It is the high crude oil (Brent blend) that gives the turnover such a boost. The average price of oil was NOK 413 per barrel in August, compared with NOK 461 in August last year, according to external trade figures .
Growth in most of the main industrial groupings
Seasonal adjusted figures show a distinct increase in all the main industrial groupings except in the energy goods in the period June to August compared with the previous three months period. For the capital goods, the export market contributed to increased turnover. For the intermediate goods and the consumer goods both the markets contributed to this development.
| Statistics on turnover of oil and gas extraction, mining and quarrying, manufacturing, electricity and gas supply. August 2006 |
|
Original series1 January-August 06 |
Changes in per cent
January-August 05 - January-August 06 |
Original series1 August 2006 |
Changes in per cent
August 05- August 06 |
Changes in per cent. Seasonally adjusted.
March.06 - June.06 - June.06 - August.06 |
|||||||||||||||||||||||||||||||||||
|---|---|---|---|---|---|---|---|---|---|---|---|---|---|---|---|---|---|---|---|---|---|---|---|---|---|---|---|---|---|---|---|---|---|---|---|---|---|---|---|
| The overall turnover | 941 587 | 26.2 | 119 216 | 20.2 | 1.1 | ||||||||||||||||||||||||||||||||||
| Oil and Gas Extraction | 375 711 | 26.3 | 45 242 | 12.2 | 3.2 | ||||||||||||||||||||||||||||||||||
| Manufacturing | 458 655 | 24.6 | 62 031 | 24.5 | 2.4 | ||||||||||||||||||||||||||||||||||
| Hjemmemarked | 280 590 | 27.5 | 37 855 | 21.2 | -0.8 | ||||||||||||||||||||||||||||||||||
| Eksportmarked | 178 065 | 20.2 | 24 176 | 29.8 | 9.6 | ||||||||||||||||||||||||||||||||||
| Electricity, Gas and Steam Supply | 99 660 | 37.1 | 10 845 | 43.5 | -5.2 | ||||||||||||||||||||||||||||||||||
| Main industrial groupings | |||||||||||||||||||||||||||||||||||||||
| Intermediate goods | 169 737 | 17.1 | 23 331 | 20.4 | 4.6 | ||||||||||||||||||||||||||||||||||
| Capital goods | 127 512 | 46.1 | 16 512 | 37.4 | 2.3 | ||||||||||||||||||||||||||||||||||
| Consumer goods | 123 883 | 12.2 | 16 593 | 15.4 | 3.8 | ||||||||||||||||||||||||||||||||||
| Energy goods | 520 455 | 29.0 | 62 780 | 17.6 | -1.2 | ||||||||||||||||||||||||||||||||||
| 1 | Million NOK. |
Find more figures
Find detailed figures from Turnover in oil and gas, manufacturing, mining and electricity supply
Additional information
The variation in manufacturing turnover can be related to changes in volume and price indices in different industries and also production to stocks and sales from stocks.
Contact
-
Robert Skotvold
E-mail: robert.skotvold@ssb.no
tel.: (+47) 40 90 24 44
-
Anne Karin Linderud Haugen
E-mail: anne.karin.linderud.haugen@ssb.no
tel.: (+47) 91 88 19 76

