Content
Published:
This is an archived release.
Strong biannual turnover in 2006
Total turnover in Norwegian manufacturing amounted to about NOK 350 billion in the January to June 2006 period, an increase of 25.1 per cent compared with the same period last year. The turnover increased in the domestic- as well as in the export market, with 29 and 19.3 per cent respectively.
Energy goods had an increase of more than 30 per cent in the first six months of 2006, compared to the same period last year. Establishments within the Norwegian oil- and gas extraction cover about 80 per cent of the turnover of energy goods. It is the high price of crude oil (Brent Blend) that gives the turnover such a boost. The average price on crude oil is 35.4 per cent higher than the first half year of 2005.
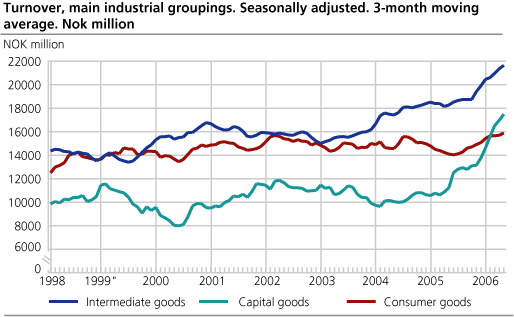
Increase in all main industrial groupings
Capital goods had the strongest growth of all the main industrial groupings. An escalation in new orders from the home and export market leads to growth in the turnover of capital goods in 2006. Machinery and equipment, oil platforms and modules and transport equipment had the largest increase within the sector and contributed strongly to the rise.
The turnover within intermediate goods also went up the first six-month period in 2006. The strongest increase is found within refined petroleum products and chemicals and chemical products and in basic metals.
Consumer goods went up by 11 per cent in the first six months of 2006, compared to the same period last year. Food and food products had a positive development with a rise of 15.4 per cent. The rise was mainly due to an increase in the turnover of fish and fish products.
| Statistics on turnover of oil and gas extraction, mining and quarrying, manufacturing, electricity and gas supply. June 2006 |
| Original series1January-June 06 |
Changes in per cent
January-June 2005 - January-June 2006 |
Original series1June 2006 | Changes in per cent June 2005-June 2006 |
Changes in per cent. Seasonally adjusted. January 2006-March 2006
-
April 2006-June 2006 |
|||||||||||||||||||||||||||||||||||
|---|---|---|---|---|---|---|---|---|---|---|---|---|---|---|---|---|---|---|---|---|---|---|---|---|---|---|---|---|---|---|---|---|---|---|---|---|---|---|---|
| The overall turnover | 713 746 | 28.2 | 126 140 | 32.8 | 8.6 | ||||||||||||||||||||||||||||||||||
| Oil and Gas Extraction | 281 689 | 29.9 | 48 270 | 44.9 | 12.3 | ||||||||||||||||||||||||||||||||||
| Manufacturing | 347 131 | 25.1 | 66 826 | 27.1 | 8.4 | ||||||||||||||||||||||||||||||||||
| Home market | 212 913 | 29.0 | 42 414 | 26.7 | 11.0 | ||||||||||||||||||||||||||||||||||
| Export market | 134 218 | 19.3 | 24 412 | 27.7 | 5.8 | ||||||||||||||||||||||||||||||||||
| Electricity, Gas and Steam Supply | 79 512 | 38.7 | 9 968 | 22.0 | -2.4 | ||||||||||||||||||||||||||||||||||
| Main industrial groupings | |||||||||||||||||||||||||||||||||||||||
| Intermediate goods | 127 845 | 16.2 | 24 489 | 20.2 | 5.1 | ||||||||||||||||||||||||||||||||||
| Capital goods | 98 816 | 50.7 | 20 177 | 40.3 | 12.0 | ||||||||||||||||||||||||||||||||||
| Consumer goods | 93 382 | 11.0 | 17 041 | 16.4 | 1.6 | ||||||||||||||||||||||||||||||||||
| Energy goods | 393 702 | 32.6 | 64 433 | 41.4 | 11.8 | ||||||||||||||||||||||||||||||||||
| 1 | NOK million. |
Find more figures
Find detailed figures from Turnover in oil and gas, manufacturing, mining and electricity supply
Additional information
The variation in manufacturing turnover can be related to changes in volume and price indices in different industries and also production to stocks and sales from stocks.
Contact
-
Robert Skotvold
E-mail: robert.skotvold@ssb.no
tel.: (+47) 40 90 24 44
-
Anne Karin Linderud Haugen
E-mail: anne.karin.linderud.haugen@ssb.no
tel.: (+47) 91 88 19 76