Content
Published:
This is an archived release.
Increased turnover in manufacturing
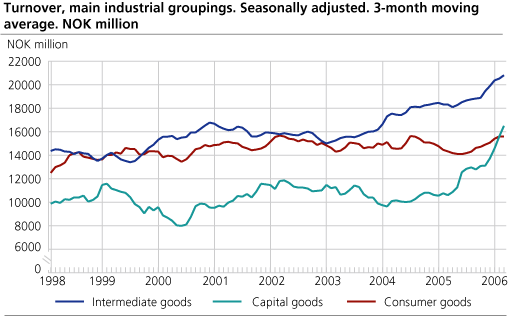
Seasonally adjusted figures show that total turnover in Norwegian manufacturing increased by 10.5 percent from February to April compared with the previous three months. The turnover increased in the domestic market as well as in the export market, with 12 .5 and 6 percent respectively.
It is the capital goods, with an increase of 20.1 per cent compared to the previous three-month period, that is the largest contributor to the high turnover within Norwegian manufacturing. The positive development for capital goods is mainly due to the strong figures within transport equipment, which is in line with the Statistics on new orders .
Growth in all main industrial groupings
The turnover within intermediate goods continuous to rise within refined petroleum products and chemical and chemical products, pulp, paper and paper products and basic metals. Intermediate goods went up with a total of 4.6 per cent.
The ongoing increase within food products, beverages and tobacco leads to a 3.5 per cent growth in consumer goods.
Turnover in Norwegian oil and gas extraction and electricity, gas and steam supply is in constant growth, and gives energy goods a solid increase by 12.7 per cent.
| Statistics on turnover of oil and gas extraction, mining and quarrying, manufacturing, electricity and gas supply. April 2006 |
| Original series1January-April 2006 | Changes in per cent January-April 2005 - January-April 2006 | Original series1April 2006 | Changes in per cent April 2005- April 2006 | Changes in per cent. Seasonally adjusted. November 2005-January 2006-February 2006-April 2006 | |||||||||||||||||||||||||||||||||||
|---|---|---|---|---|---|---|---|---|---|---|---|---|---|---|---|---|---|---|---|---|---|---|---|---|---|---|---|---|---|---|---|---|---|---|---|---|---|---|---|
| The overall turnover | 467 437 | 27.4 | 120 145 | 20.3 | 10.4 | ||||||||||||||||||||||||||||||||||
| Oil and Gas Extraction | 185 584 | 27.2 | 49 097 | 21.6 | 5.2 | ||||||||||||||||||||||||||||||||||
| Manufacturing | 219 398 | 23.3 | 56 708 | 18.0 | 10.5 | ||||||||||||||||||||||||||||||||||
| Hjemmemarked | 131 625 | 27.9 | 35 595 | 28.4 | 12.5 | ||||||||||||||||||||||||||||||||||
| Eksportmarked | 87 773 | 16.9 | 21 113 | 3.9 | 6.0 | ||||||||||||||||||||||||||||||||||
| Electricity, Gas and Steam Supply | 59 244 | 48.1 | 13 541 | 27.8 | 27.5 | ||||||||||||||||||||||||||||||||||
| Main industrial groupings | |||||||||||||||||||||||||||||||||||||||
| Intermediate goods | 80 306 | 13.6 | 19 578 | 2.6 | 4.6 | ||||||||||||||||||||||||||||||||||
| Capital goods | 61 294 | 53.7 | 18 047 | 63.3 | 20.1 | ||||||||||||||||||||||||||||||||||
| Consumer goods | 59 901 | 8.5 | 14 001 | -2.5 | 3.5 | ||||||||||||||||||||||||||||||||||
| Energy goods | 265 936 | 32.1 | 68 519 | 23.7 | 12.7 | ||||||||||||||||||||||||||||||||||
| 1 | NOK million. |
Find more figures
Find detailed figures from Turnover in oil and gas, manufacturing, mining and electricity supply
Additional information
The variation in manufacturing turnover can be related to changes in volume and price indices in different industries and also production to stocks and sales from stocks.
Contact
-
Robert Skotvold
E-mail: robert.skotvold@ssb.no
tel.: (+47) 40 90 24 44
-
Anne Karin Linderud Haugen
E-mail: anne.karin.linderud.haugen@ssb.no
tel.: (+47) 91 88 19 76

