Content
Published:
This is an archived release.
Steady growth in turnover
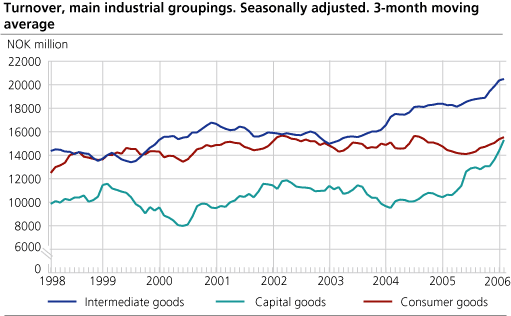
Seasonally adjusted figures show that total turnover in Norwegian manufacturing increased by 9.2 per cent in the first quarter of 2006 compared with the last quarter of 2005. The turnover is increasing in the domestic market as well as in the export market, with 9.7 and 5.1 per cent respectively.
Norwegian manufacturing had a growth in all the main industrial groupings. Capital goods are still leading the way, with an increase of 17 per cent. The positive development for capital goods is mainly due to the strong figures within machinery and equipment as well as oil platforms and modules.
Growth in intermediate goods
The turnover within intermediate goods is also marked by strong demand. Refined petroleum products and chemical and chemical products, pulp, paper and paper products and basic metals have all increased turnover compared to the previous quarter. One explanation can be the growing demand in the export market as well as a rise in the export prices.
There was also an improvement in the turnover for consumer goods this first quarter of 2006 compared to the fourth quarter of 2005. The largest contributor within this industry, food products, beverages and tobacco, increased their turnover by 5 per cent. Publishing, printing and reproduction and furniture and other manufacturing also showed positive development this first quarter.
|
Statistics on turnover of oil and gas extraction, mining and quarrying, manufacturing, electricity and gas supply.
March 2006 |
|
Original series1 January-March 2006 |
Changes in per cent
January-March 2005 - January-March 2006 |
Original series1 March 2006 |
Changes in per cent
March 2005- March 2006 |
Changes in per cent.
Seasonally adjusted. October-December 2005 - January-March 2006 |
|||||||||||||||||||||||||||||||||||
|---|---|---|---|---|---|---|---|---|---|---|---|---|---|---|---|---|---|---|---|---|---|---|---|---|---|---|---|---|---|---|---|---|---|---|---|---|---|---|---|
| The overall turnover | 347 438 | 30.1 | 127 060 | 33.1 | 10.3 | ||||||||||||||||||||||||||||||||||
| Oil and Gas Extraction | 136 550 | 29.4 | 48 002 | 27.4 | 7.5 | ||||||||||||||||||||||||||||||||||
| Manufacturing | 162 850 | 25.3 | 61 135 | 30.9 | 9.2 | ||||||||||||||||||||||||||||||||||
| Heimemarked | 96 108 | 27.8 | 36 615 | 36.0 | 9.7 | ||||||||||||||||||||||||||||||||||
| Eksportmarked | 66 742 | 21.9 | 24 520 | 24.0 | 5.1 | ||||||||||||||||||||||||||||||||||
| Electricity, Gas and Steam Supply | 45 625 | 55.2 | 16 941 | 65.2 | 23.4 | ||||||||||||||||||||||||||||||||||
| Main industrial groupings | |||||||||||||||||||||||||||||||||||||||
| Intermediate goods | 60 914 | 18.0 | 22 823 | 29.6 | 5.3 | ||||||||||||||||||||||||||||||||||
| Capital goods | 43 331 | 50.3 | 17 115 | 53.1 | 17.0 | ||||||||||||||||||||||||||||||||||
| Consumer goods | 45 790 | 12.1 | 17 046 | 17.3 | 4.2 | ||||||||||||||||||||||||||||||||||
| Energy goods | 197 402 | 35.3 | 70 076 | 34.4 | 11.9 | ||||||||||||||||||||||||||||||||||
| 1 | NOK million. |
Find more figures
Find detailed figures from Turnover in oil and gas, manufacturing, mining and electricity supply
Additional information
The variation in manufacturing turnover can be related to changes in volume and price indices in different industries and also production to stocks and sales from stocks.
Contact
-
Robert Skotvold
E-mail: robert.skotvold@ssb.no
tel.: (+47) 40 90 24 44
-
Anne Karin Linderud Haugen
E-mail: anne.karin.linderud.haugen@ssb.no
tel.: (+47) 91 88 19 76

