Content
Published:
This is an archived release.
Increase in turnover so far in 2005
Total turnover in Norwegian manufacturing amounted to NOK 266 billion in the January to June 2005 period, an increase of 2.6 per cent compared with the same period last year. Intermediate goods and capital goods were the main drivers behind the positive development, whereas the turnover of consumer goods was below last year's level.
Turnover in Norwegian oil and gas extraction amounted to NOK 243 billion in the first six months of 2005, up almost 24 per cent on the same period last year. The average price of oil was approximately 35 per cent higher in the first six months of 2005 than in the same period last year. The production of oil was somewhat lower, whereas the production of gas has improved.
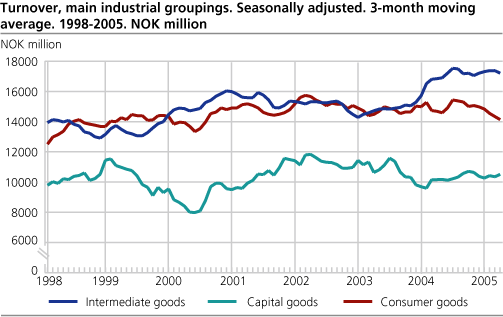
Intermediate goods
The turnover of intermediate goods increased in the first six months of 2005 compared with the same period last year. Wood and wood products, refined petroleum products, and chemicals and chemical products experienced the strongest growth, whereas there was a fall in the turnover of basic metals and pulp, paper and paper products.
Capital goods
Capital goods had the strongest growth of all the main industrial groupings. Fabricated metal products and transport equipment had the largest increase of the capital goods. A further boost in new orders from the home and export market seems to ensure stable growth in the total stock of orders, which may lead to continued growth in the turnover of capital goods. Only electrical and optical equipment experienced a decrease in the first six months of this year.
Consumer goods
Compared with the same period last year, the turnover of consumer goods has fallen so far in 2005. The fall is mainly due to reduced turnover of food and food products, but the turnover has also fallen in publishing, printing, and reproduction. Furniture, other manufacturing and recycling and textile, wearing apparel and leather show a positive result in this period.
| Statistics on turnover of oil and gas extraction, mining and quarrying, manufacturing, electricity and gas supply. June 2005 |
| Original series1January-June 2005 | Changes in per cent January-June 2004-January-June 2005 | Original series1June 2005 | Changes in per cent June 2004-June 2005 | Changes in per cent. Seasonally adjusted. January-March 2005-April-June 2005 | |||||||||||||||||||||||||||||||||||
|---|---|---|---|---|---|---|---|---|---|---|---|---|---|---|---|---|---|---|---|---|---|---|---|---|---|---|---|---|---|---|---|---|---|---|---|---|---|---|---|
| The overall turnover | 570 769 | 11.1 | 96 471 | 6.1 | 5.6 | ||||||||||||||||||||||||||||||||||
| Oil and gas extraction | 242 966 | 23.7 | 37 916 | 15.5 | 8.1 | ||||||||||||||||||||||||||||||||||
| Manufacturing | 265 590 | 2.6 | 49 318 | 0.6 | -1.6 | ||||||||||||||||||||||||||||||||||
| Electricity, gas and steam supply | 57 475 | 5.7 | 8 305 | 0.2 | 27.9 | ||||||||||||||||||||||||||||||||||
| Main industrial groupings | |||||||||||||||||||||||||||||||||||||||
| Intermediate goods | 103 434 | 2.8 | 19 141 | -0.7 | -0.7 | ||||||||||||||||||||||||||||||||||
| Capital goods | 62 790 | 6.4 | 13 124 | 11.6 | 2.9 | ||||||||||||||||||||||||||||||||||
| Consumer goods | 83 743 | -5.1 | 14 902 | -7.3 | -3.3 | ||||||||||||||||||||||||||||||||||
| Energy goods | 320 802 | 20.7 | 49 303 | 12.5 | 11.1 | ||||||||||||||||||||||||||||||||||
| 1 | NOK million. |
Find more figures
Find detailed figures from Turnover in oil and gas, manufacturing, mining and electricity supply
Additional information
The variation in manufacturing turnover can be related to changes in volume and price indices in different industries and also production to stocks and sales from stocks.
Contact
-
Robert Skotvold
E-mail: robert.skotvold@ssb.no
tel.: (+47) 40 90 24 44
-
Anne Karin Linderud Haugen
E-mail: anne.karin.linderud.haugen@ssb.no
tel.: (+47) 91 88 19 76