Content
Published:
This is an archived release.
Continued decline in manufacturing
According to seasonally adjusted figures the turnover in manufacturing continued to decline in the last three months period, when compared with the previous period. Especially consumer goods influenced the total turnover in a negative direction.
The turnover within Norwegian Oil- and Gas extraction rose by 14.6 per cent in the last three months period. This rise is mainly due to high prices on oil, where the average price on crude oil is up 20 per cent, compared to the previous three months period.
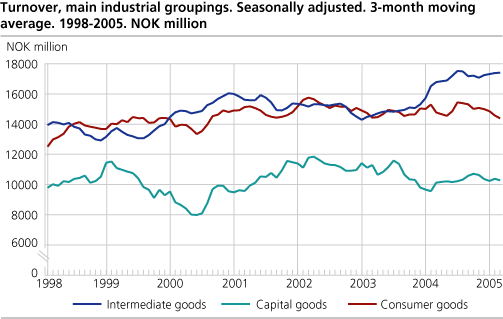
Continuous increase within intermediate goods
The turnover within intermediate goods experience a rise of 0.7 per cent from the previous three months period, although the figures are negative from March to April. This is mainly due to an increase in turnover within other non-metallic mineral products, whereas turnover declined for pulp, paper and paper products and basic chemicals. From March to April, the division pulp, paper and paper products shows a noticeably more positive development.
Decline in capital goods
Whereas intermediate goods are experiencing growth, capital goods continue to decrease. Although there is an increase in turnover within fabricated metal products, machinery and equipment and oil platforms, there is a decline in electrical and optical equipment and transport equipment, which affects the development within this industrial grouping.
Consumer goods down
Even within consumer goods a decline can be seen in this last three months period. This is mainly due to the fall within the non-durable consumer goods, such as food products, beverages and tobacco. Still, it is noteworthy to mention the increase from March to April within the same division.
| Statistics on turnover of oil and gas extraction, mining and quarrying, manufacturing, electricity and gas supply. April 2005 |
| Original series1April 2005 | Changes in per cent April 2004-April 2005 | Original series1January-April 2005 | Changes in per cent January-April 2004-January-April 2005 | Changes in per cent. Seasonally adjusted. November 2004-January 2005-February 2005-April 2005 | |||||||||||||||||||||||||||||||||||
|---|---|---|---|---|---|---|---|---|---|---|---|---|---|---|---|---|---|---|---|---|---|---|---|---|---|---|---|---|---|---|---|---|---|---|---|---|---|---|---|
| The overall turnover | 100 173 | 18.4 | 374 628 | 10.3 | 7.3 | ||||||||||||||||||||||||||||||||||
| Oil and Gas Extraction | 43 371 | 26.9 | 160 415 | 22.9 | 14.6 | ||||||||||||||||||||||||||||||||||
| Manufacturing | 45 240 | 9.4 | 171 088 | 1.7 | -2.2 | ||||||||||||||||||||||||||||||||||
| Electricity, Gas and Steam Supply | 10 684 | 26.9 | 40 174 | 4.3 | 15.6 | ||||||||||||||||||||||||||||||||||
| Main industrial groupings | |||||||||||||||||||||||||||||||||||||||
| Intermediate goods | 18 165 | 12.8 | 66 746 | 2.7 | 1.0 | ||||||||||||||||||||||||||||||||||
| Capital goods | 10 711 | 4.7 | 38 627 | 2.9 | -0.8 | ||||||||||||||||||||||||||||||||||
| Consumer goods | 14 163 | 3.7 | 54 643 | -6.0 | -4.1 | ||||||||||||||||||||||||||||||||||
| Energy goods | 57 134 | 28.0 | 214 613 | 19.8 | 17.4 | ||||||||||||||||||||||||||||||||||
| 1 | NOK million. |
Find more figures
Find detailed figures from Turnover in oil and gas, manufacturing, mining and electricity supply
Additional information
The variation in manufacturing turnover can be related to changes in volume and price indices in different industries and also production to stocks and sales from stocks.
Contact
-
Robert Skotvold
E-mail: robert.skotvold@ssb.no
tel.: (+47) 40 90 24 44
-
Anne Karin Linderud Haugen
E-mail: anne.karin.linderud.haugen@ssb.no
tel.: (+47) 91 88 19 76

