Content
Published:
This is an archived release.
Slight drop in manufacturing
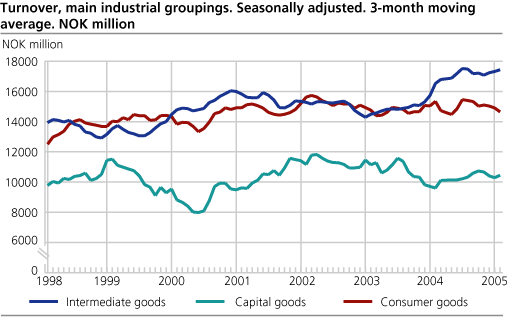
According to seasonally adjusted figures the total turnover in manufacturing dropped by 2.6 per cent in the first quarter of 2005, compared with the fourth quarter in 2004. Capital- and consumer goods experienced a decline, while intermediate- and energy goods increased slightly.
Turnover within Norwegian Oil- and Gas extraction came to NOK 117 billion in the first quarter of 2005, up 4.5 per cent compared with the fourth quarter last year. According to the External merchandise trade statistics, the average price for oil in March 2005 was a record high NOK 329. In spite of a decline in production, this record-breaking price gives an overall upturn in the total turnover within this sector.
Increase in intermediate goods
The turnover within intermediate goods rose by 2.1 per cent the first quarter compared with the previous quarter. Other non-metallic mineral products increased by 6.6 per cent, while wood and wood products grew by 2.5 per cent. Refined petroleum products, chemicals and chemicals products and basic chemicals declined their turnover this quarter.
Increase in capital goods
Within capital goods the turnover went down by 2 per cent compared with the previous quarter. Fabricated metal products and machinery and equipment increased, while electrical and optical equipment decreased this quarter.
Consumer goods up
Consumer goods decreased by 3 per cent in the first quarter of 2005 compared with the last quarter in 2004. The largest drop can be seen within food and food products followed by furniture and recycling, while textiles, wearing apparel and leather went up.
| Statistics on turnover of oil and gas extraction, mining and quarrying, manufacturing, electricity and gas supply. March 2005 |
| Original series1March 2005 | Changes in per cent March 2004-March 2005 | Original series1January-March 2005 | Changes in per cent January-March 2004-January-March 2005 | Changes in per cent. Seasonally adjusted. October-December 2004-January-March 2005 | |||||||||||||||||||||||||||||||||||
|---|---|---|---|---|---|---|---|---|---|---|---|---|---|---|---|---|---|---|---|---|---|---|---|---|---|---|---|---|---|---|---|---|---|---|---|---|---|---|---|
| The overall turnover | 100 326 | 11.2 | 274 458 | 7.6 | 1.1 | ||||||||||||||||||||||||||||||||||
| Oil and Gas Extraction | 43 936 | 36.3 | 117 053 | 21.5 | 4.5 | ||||||||||||||||||||||||||||||||||
| Manufacturing | 45 353 | -6.9 | 125 933 | -0.8 | -2.6 | ||||||||||||||||||||||||||||||||||
| Electricity, Gas and Steam Supply | 10 255 | 19.1 | 29 404 | -2.3 | -3.4 | ||||||||||||||||||||||||||||||||||
| Main industrial groupings | |||||||||||||||||||||||||||||||||||||||
| Intermediate goods | 16 758 | -9.7 | 48 717 | -0.3 | 2.1 | ||||||||||||||||||||||||||||||||||
| Capital goods | 10 781 | -3.5 | 27 841 | 2.0 | -2.0 | ||||||||||||||||||||||||||||||||||
| Consumer goods | 14 398 | -14.0 | 40 500 | -9.0 | -3.0 | ||||||||||||||||||||||||||||||||||
| Energy goods | 58 389 | 33.4 | 157 401 | 17.0 | 3.7 | ||||||||||||||||||||||||||||||||||
| 1 | NOK million. |
Find more figures
Find detailed figures from Turnover in oil and gas, manufacturing, mining and electricity supply
Additional information
The variation in manufacturing turnover can be related to changes in volume and price indices in different industries and also production to stocks and sales from stocks.
Contact
-
Robert Skotvold
E-mail: robert.skotvold@ssb.no
tel.: (+47) 40 90 24 44
-
Anne Karin Linderud Haugen
E-mail: anne.karin.linderud.haugen@ssb.no
tel.: (+47) 91 88 19 76

