Content
Published:
This is an archived release.
Continuous increase in manufacturing
Total turnover in Norwegian manufacturing amounted to nearly NOK 50 billion in October 2004. All main industrial groupings experienced positive growth during the last three-month period compared with the previous period. Capital goods are, however, the only industrial grouping that shows positive figures from September to October.
Turnover within Norwegian oil and gas extraction sector experienced a growth of 7.3 per cent and must be seen in connection with continuous growth in prices on crude oil. In October, the average price on crude oil came to NOK 327, an increase in prices 10.6 per cent compared with the previous month.
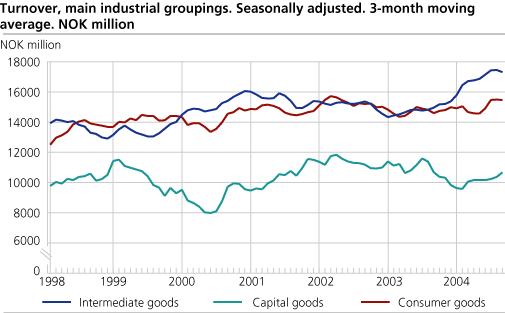
Intermediate goods
Seasonally adjusted figures from the last three-month period show continued increase for intermediate goods, but not by the same strength as in earlier periods. Numerous sectors within this grouping experienced a decline in turnover from September to October, meanwhile refined petroleum products and chemical products and rubber and plastic products increased in this period.
Capital goods
Capital goods grew by 5 per cent and close to all the sectors have a positive development. The monthly figures from September to October are also higher than within intermediate goods.
Consumer goods
The largest sector within this industrial grouping, food and food products, increased by 3.9 per cent. It is worth noticing the positive trend in the industry for fish and fish products, which has lasted since May. In the remaining sectors within this industry only a few experienced an increase from September to October.
| Statistics on turnover of oil and gas extraction, mining and quarrying, manufacturing, electricity and gas supply. October 2004 |
| Original series October 2004 |
Changes in per cent
October 2003- October 2004 |
Original series1January-October 2004 | Changes in per cent January-October 2003 - January-October 2004 |
Changes in per cent. Seasonally adjusted. May-July 2004-
August-October 2004 |
|||||||||||||||||||||||||||||||||||
|---|---|---|---|---|---|---|---|---|---|---|---|---|---|---|---|---|---|---|---|---|---|---|---|---|---|---|---|---|---|---|---|---|---|---|---|---|---|---|---|
| The overall turnover | 100 729 | 17.3 | 887 045 | 8.4 | 4.6 | ||||||||||||||||||||||||||||||||||
| Oil and Gas Extraction | 41 182 | 46.4 | 350 557 | 21.3 | 7.3 | ||||||||||||||||||||||||||||||||||
| Manufacturing | 49 792 | 6.5 | 442 725 | 5.0 | 6.8 | ||||||||||||||||||||||||||||||||||
| Electricity, Gas and Steam Supply | 8 685 | -16.0 | 85 397 | -16.8 | -7.9 | ||||||||||||||||||||||||||||||||||
| Main industrial groupings | |||||||||||||||||||||||||||||||||||||||
| Intermediate goods | 18 357 | 6.1 | 170 900 | 14.9 | 1.0 | ||||||||||||||||||||||||||||||||||
| Capital goods | 11 402 | 4.9 | 98 864 | -7.0 | 5.0 | ||||||||||||||||||||||||||||||||||
| Consumer goods | 16 068 | -4.1 | 150 126 | 2.4 | 3.7 | ||||||||||||||||||||||||||||||||||
| Energy goods | 54 902 | 34.1 | 467 150 | 12.1 | 4.8 | ||||||||||||||||||||||||||||||||||
| 1 | NOK million. |
Find more figures
Find detailed figures from Turnover in oil and gas, manufacturing, mining and electricity supply
Additional information
The variation in manufacturing turnover can be related to changes in volume and price indices in different industries and also production to stocks and sales from stocks.
Contact
-
Robert Skotvold
E-mail: robert.skotvold@ssb.no
tel.: (+47) 40 90 24 44
-
Anne Karin Linderud Haugen
E-mail: anne.karin.linderud.haugen@ssb.no
tel.: (+47) 91 88 19 76