Content
Published:
This is an archived release.
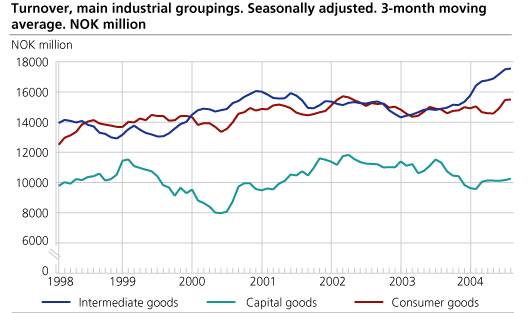
Third quarter - increase in manufacturing
Seasonally adjusted figures show that total turnover in Norwegian manufacturing ended close to 134 billion in the third quarter 2004. The growth is recorded in all main industrial groupings. So far this year, the turnover within Norwegian manufacturing has increased by nearly 5 per cent.
From the second quarter of 2004 to the last quarter of 2004, seasonally adjusted figures show that the production of oil and gas increased by 7 per cent. This increase must be seen in connection with the significant growth in prices for crude oil.
Growth in intermediate goods
Figures for the third quarter show a growth in total turnover for intermediate goods. This growth was strongest for chemical products. The growth in turnover within this industry was 0.9 per cent compared with the previous quarter.
Slight increase within capital goods
Seasonally adjusted figures from the third quarter show a slight increase in turnover for capital goods compared with last quarter. Most industries recorded a slight rise in turnover. However, the decreased turnover within transport equipment by 0.9 per cent had a reducing overall effect.
Growth in consumer goods
Turnover within consumer goods also increased in the third quarter. The growth in turnover of food products was particularly strong, but also within publishing, printing and reproduction the increase was considerable, 5.9 per cent and 6.2 per cent respectively.
| Statistics on turnover of oil and gas extraction, mining and quarrying, manufacturing, electricity and gas supply. September 2004 |
| Original series September 2004 | Changes in per cent September 2003-September 2004 | Original series1January-September 2004 | Changes in per cent January-September 2003-January-September 2004 | Changes in per cent. Seasonally adjusted. April-June 2004-July-September 2004 | |||||||||||||||||||||||||||||||||||
|---|---|---|---|---|---|---|---|---|---|---|---|---|---|---|---|---|---|---|---|---|---|---|---|---|---|---|---|---|---|---|---|---|---|---|---|---|---|---|---|
| The overall turnover | 96 641 | 18.6 | 786 316 | 7.3 | 7.1 | ||||||||||||||||||||||||||||||||||
| Oil and Gas Extraction | 37 231 | 37.6 | 309 375 | 18.6 | 7.0 | ||||||||||||||||||||||||||||||||||
| Manufacturing | 51 225 | 11.7 | 392 933 | 4.9 | 7.5 | ||||||||||||||||||||||||||||||||||
| Electricity, Gas and Steam Supply | 7 022 | -11.2 | 76 712 | -16.9 | 5.4 | ||||||||||||||||||||||||||||||||||
| Main industrial groupings | |||||||||||||||||||||||||||||||||||||||
| Intermediate goods | 19 566 | 18.3 | 152 543 | 16.1 | 4.0 | ||||||||||||||||||||||||||||||||||
| Capital goods | 11 800 | 1.2 | 87 462 | -8.4 | 1.5 | ||||||||||||||||||||||||||||||||||
| Consumer goods | 16 821 | 5.1 | 134 058 | 3.2 | 6.4 | ||||||||||||||||||||||||||||||||||
| Energy goods | 48 454 | 30.1 | 412 248 | 9.7 | 8.2 | ||||||||||||||||||||||||||||||||||
| 1 | NOK Million. |
Find more figures
Find detailed figures from Turnover in oil and gas, manufacturing, mining and electricity supply
Additional information
The variation in manufacturing turnover can be related to changes in volume and price indices in different industries and also production to stocks and sales from stocks.
Contact
-
Robert Skotvold
E-mail: robert.skotvold@ssb.no
tel.: (+47) 40 90 24 44
-
Anne Karin Linderud Haugen
E-mail: anne.karin.linderud.haugen@ssb.no
tel.: (+47) 91 88 19 76

