Content
Published:
This is an archived release.
Continued increase in manufacturing
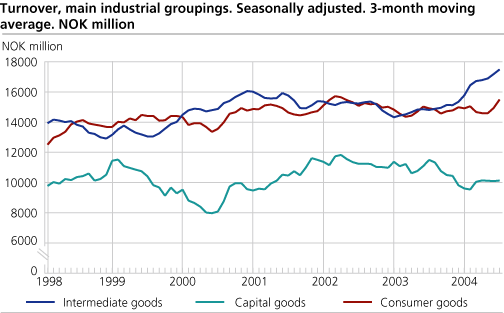
Total turnover in Norwegian manufacturing increased again in August. Seasonally adjusted figures show turnover growth in three of the four main industrial groupings. Figures for the fourth industrial grouping, intermediate goods, show stable turnover compared with the previous three-month period.
Turnover within the Norwegian oil and gas extraction industry was somewhat lower than last month. Total turnover amounted to slightly over NOK 34 billion in August. Despite a high average price of oil, NOK 304 per barrel in August, the decrease in volume was so significant that the total turnover dropped. The turnover dropped mainly due to maintenance work and high export volumes in July.
Growth in intermediate goods
Seasonally adjusted figures for the last three-month period show a significant growth in total turnover for intermediate goods. The growth was strongest for refined petroleum products and chemicals and chemical products. The growth in turnover in this industry over the last three-month period was 16.2 per cent when compared with the previous period.
Stable turnover of capital goods
Seasonally adjusted figures from the last three-month period show stable turnover for capital goods. Most industries experienced a slight rise in turnover, however, fabricated metal products saw turnover fall by 2.0 per cent.
Growth in consumer goods
Turnover within consumer goods also increased over the last three-month period. The growth in turnover of food products was particularly strong. Seasonally adjusted figures show turnover growth at approximately 6.8 per cent compared with the previous three-month period.
| Statistics on turnover of oil and gas extraction, mining and quarrying, manufacturing, electricity and gas supply. August 2004 |
| Original series August 2004 | Changes in per cent August 2003-August 2004 | Original series1January-August 2004 | Changes in per cent January-August 2003-January-August 2004 | Changes in per cent. Seasonally adjusted. March-May 2004-June-August 2004 | |||||||||||||||||||||||||||||||||||
|---|---|---|---|---|---|---|---|---|---|---|---|---|---|---|---|---|---|---|---|---|---|---|---|---|---|---|---|---|---|---|---|---|---|---|---|---|---|---|---|
| The overall turnover | 88 325 | 12.1 | 689 675 | 5.9 | 6.2 | ||||||||||||||||||||||||||||||||||
| Oil and Gas Extraction | 34 285 | 11.4 | 272 144 | 16.4 | 1.0 | ||||||||||||||||||||||||||||||||||
| Manufacturing | 45 915 | 12.2 | 341 708 | 3.9 | 6.2 | ||||||||||||||||||||||||||||||||||
| Electricity, Gas and Steam Supply | 7 001 | 6.0 | 69 690 | -17.4 | 30.9 | ||||||||||||||||||||||||||||||||||
| Main industrial groupings | |||||||||||||||||||||||||||||||||||||||
| Intermediate goods | 17 734 | 20.5 | 132 977 | 15.8 | 4.2 | ||||||||||||||||||||||||||||||||||
| Capital goods | 9 693 | -7.4 | 75 662 | -9.7 | 0.0 | ||||||||||||||||||||||||||||||||||
| Consumer goods | 15 529 | 14.2 | 117 237 | 2.9 | 6.2 | ||||||||||||||||||||||||||||||||||
| Energy goods | 45 368 | 13.3 | 363 794 | 7.4 | 6.2 | ||||||||||||||||||||||||||||||||||
| 1 | NOK million. |
Find more figures
Find detailed figures from Turnover in oil and gas, manufacturing, mining and electricity supply
Additional information
The variation in manufacturing turnover can be related to changes in volume and price indices in different industries and also production to stocks and sales from stocks.
Contact
-
Robert Skotvold
E-mail: robert.skotvold@ssb.no
tel.: (+47) 40 90 24 44
-
Anne Karin Linderud Haugen
E-mail: anne.karin.linderud.haugen@ssb.no
tel.: (+47) 91 88 19 76

