Content
Published:
This is an archived release.
Increase in manufacturing
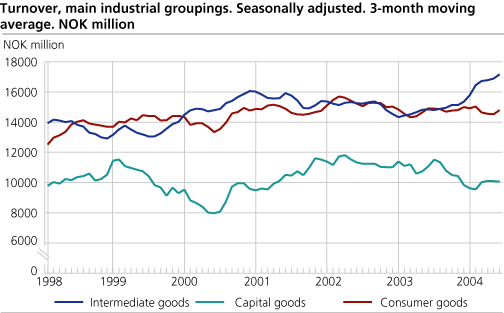
Total turnover in Norwegian manufacturing amounted to almost NOK 128 billion from May to July 2004, a 3.2 per cent rise from the same period in 2003. According to seasonally adjusted figures, all main industrial groupings experienced positive growth during the last three months compared with the previous three-month period.
Turnover in the Norwegian oil and gas extraction sector amounted to approximately NOK 41.5 billion in July, an increase of 40.9 per cent compared with July last year. The average price of oil was NOK 266 per barrel in July, compared with NOK 210 in July last year, according to external trade figures .
Intermediate goods
Seasonally adjusted figures for the last three-month period show a 2.6 per cent increase in turnover of intermediate goods compared with the previous period. There was an increase in all sectors except basic metals and wood and wood products.
Capital goods
Turnover of capital goods increased by 0.4 per cent in the last three-month period, according to seasonally adjusted figures. Oil platforms and modules and electrical and optical equipment both experienced increased turnover. There was a decrease in turnover of manufactures of transport equipment, however.
Consumer goods
The turnover of consumer goods also shows an increase over the last three months. Food products, textiles, wearing apparel and leather, and the furniture industry have all had a significant increase in turnover. Publishing, printing and reproduction show negative growth in the same period.
| Statistics on turnover of oil and gas extraction, mining and quarrying, manufacturing, electricity and gas supply. July 2004 |
| Original series July 2004 | Changes in per cent July 2003-July 2004 | Original series1January-July 2004 | Changes in per cent January-July 2003-January-July 2004 | Seasonally adjusted changes in per cent June-July 2004 | |||||||||||||||||||||||||||||||||||
|---|---|---|---|---|---|---|---|---|---|---|---|---|---|---|---|---|---|---|---|---|---|---|---|---|---|---|---|---|---|---|---|---|---|---|---|---|---|---|---|
| The overall turnover | 87 771 | 18.4 | 601 350 | 5.1 | 7.7 | ||||||||||||||||||||||||||||||||||
| Oil and Gas Extraction | 41 453 | 40.9 | 237 859 | 17.1 | 15.3 | ||||||||||||||||||||||||||||||||||
| Manufacturing | 36 939 | -1.1 | 295 793 | 2.7 | 0.1 | ||||||||||||||||||||||||||||||||||
| Electricity, Gas and Steam Supply | 8 334 | 21.4 | 62 689 | -19.4 | -3.4 | ||||||||||||||||||||||||||||||||||
| Main industrial groupings | |||||||||||||||||||||||||||||||||||||||
| Intermediate goods | 14 588 | 15.2 | 115 243 | 15.1 | 0.2 | ||||||||||||||||||||||||||||||||||
| Capital goods | 6 975 | -19.0 | 65 969 | -10 | 0.5 | ||||||||||||||||||||||||||||||||||
| Consumer goods | 13 467 | -4.5 | 101 708 | 1.4 | -0.8 | ||||||||||||||||||||||||||||||||||
| Energy goods | 52 741 | 36.0 | 318 426 | 6.6 | 10.4 | ||||||||||||||||||||||||||||||||||
| 1 | NOK Million. |
Find more figures
Find detailed figures from Turnover in oil and gas, manufacturing, mining and electricity supply
Additional information
The variation in manufacturing turnover can be related to changes in volume and price indices in different industries and also production to stocks and sales from stocks.
Contact
-
Robert Skotvold
E-mail: robert.skotvold@ssb.no
tel.: (+47) 40 90 24 44
-
Anne Karin Linderud Haugen
E-mail: anne.karin.linderud.haugen@ssb.no
tel.: (+47) 91 88 19 76

