Content
Published:
This is an archived release.
Increase in manufacturing
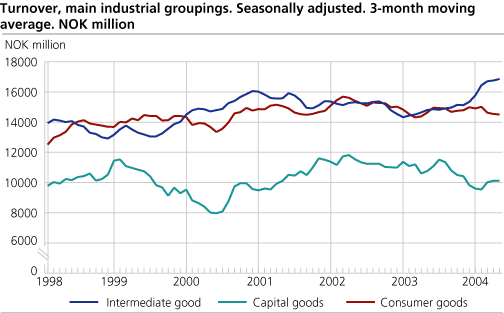
The total turnover in Norwegian manufacturing amounted to NOK 260 billion from January to June 2004, a 3.3 per cent rise from the same period in 2003. Turnover within intermediate goods and consumers goods pull in a positive direction, whereas turnover within capital goods is below last years level.
Turnover within Norwegian oil and gas extraction was NOK 33 billion in June, close to 30 per cent compared with the same month last year. The average price of oil was NOK 259 per barrel in June 2004, compared with NOK 194 in June last year according to external trade figures.
Intermediate goods
All sectors within intermediate goods experienced an increase during the first six months of 2004, compared with the same period last year. The strongest increase is found within basic metals and basic chemicals, but there was also a marked increase in wood and wood products and in pulp, paper and paper products.
Capital goods
Turnover within capital goods had a decrease close to 9 per cent in the first six month period in 2004, compared to same period last year. The decrease included the majority of the sectors within capital goods, but the strongest decline was within transport equipment. Still, the increase within electrical and optical equipment subdues the overall decrease for capital goods.
Consumer goods
Turnover for consumer goods shows a total increase of 2.4 per cent compared to the six month period last year. The raise is mainly due to growth within food and food products, but also publishing, printing, reproduction and furniture, other manufacturing., and recycling show a positive result this period. However, textile, wearing apparel and leather had a decline in turnover.
| Statistics on turnover of oil and gas extraction, mining and quarrying, manufacturing, electricity and gas supply. June 2004 |
| Original series1June 2004 | Changes in per cent June 2003-June 2004 | Original series1January-June 2004 | Changes in per cent January-June 2003-January-June 2004 | Seasonally adjusted changes in per cent May-June 2004 | |||||||||||||||||||||||||||||||||||
|---|---|---|---|---|---|---|---|---|---|---|---|---|---|---|---|---|---|---|---|---|---|---|---|---|---|---|---|---|---|---|---|---|---|---|---|---|---|---|---|
| The overall turnover | 90 916 | 17.9 | 513 579 | 3.1 | 2.3 | ||||||||||||||||||||||||||||||||||
| Oil and Gas Extraction | 32 841 | 29.8 | 196 406 | 13.1 | -1.9 | ||||||||||||||||||||||||||||||||||
| Manufacturing | 49 030 | 10.2 | 258 854 | 3.3 | 6.2 | ||||||||||||||||||||||||||||||||||
| Electricity, Gas and Steam Supply | 8 286 | 23.7 | 54 355 | -23.4 | 21.3 | ||||||||||||||||||||||||||||||||||
| Main industrial groupings | |||||||||||||||||||||||||||||||||||||||
| Intermediate goods | 19 267 | 22.5 | 100 655 | 15.1 | 4.9 | ||||||||||||||||||||||||||||||||||
| Capital goods | 11 755 | -3.5 | 58 994 | -8.8 | 0.7 | ||||||||||||||||||||||||||||||||||
| Consumer goods | 16 072 | 8.1 | 88 241 | 2.4 | 5.3 | ||||||||||||||||||||||||||||||||||
| Energy goods | 43 821 | 27.7 | 265 685 | 2.2 | 0.9 | ||||||||||||||||||||||||||||||||||
| 1 | NOK million. |
Find more figures
Find detailed figures from Turnover in oil and gas, manufacturing, mining and electricity supply
Additional information
The variation in manufacturing turnover can be related to changes in volume and price indices in different industries and also production to stocks and sales from stocks.
Contact
-
Robert Skotvold
E-mail: robert.skotvold@ssb.no
tel.: (+47) 40 90 24 44
-
Anne Karin Linderud Haugen
E-mail: anne.karin.linderud.haugen@ssb.no
tel.: (+47) 91 88 19 76

