Content
Published:
This is an archived release.
Continued rise in turnover for manufacturing
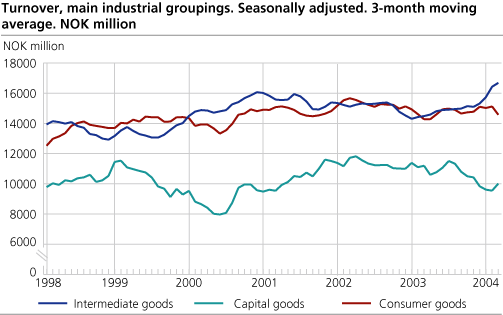
Total turnover in Norwegian manufacturing amounted to approximately NOK 168 billion from January to April, a 2.4 per cent rise from the same period in 2003. Turnover within intermediate goods pull in a positive direction, whereas turnover within capital goods is well below last years level.
Turnover within Norwegian Oil- and Gas extraction was NOK 34 billion in April, up 27.5 per cent from the same period in 2003, mainly due to the high prices on crude oil. According to the External merchandise trade statistics, the average price for oil in April 2004 was NOK 233 per barrel compared with NOK 185 in April last year.
Increase in intermediate goods
The positive development for intermediate goods is mainly due to an increase in basic chemicals, pulp, paper and paper products and basic metals. The latter standing for a growth of 33 per cent during the first four months this year compared to the same period last year. Though showing a drop from March to April, only confirms the notably high turnover in March.
Increase in capital goods
Turnover within capital goods have decreased by 11.7 per cent the last four months compared to the same period last year. This decline includes almost all industries except those producing electrical and optical equipment. The strongest decline can be seen within the production of transport equipment. Still, the average turnover for the last three-month period compared to the previous three-month period shows a slight increase of 1.8 per cent for capital goods. All industries show positive growth in this period.
Consumer goods up
Also an increase can be seen within consumer goods these first four months, when compared to last years figures. Food, beverages and tobacco, publishing, printing and reproduction as well as manufacturing of furniture are all industries within this grouping that experienced an increase in this period.
| Statistics on turnover of oil and gas extraction, mining and quarrying, manufacturing, electricity and gas supply. April 2004 |
| Original series. March 2004 | Changes in per cent. April 2003- April 2004 | Original series1. January-April 2004 | Changes in per cent. January-April 2003- January-April 2004 | Seasonally adjusted changes in per cent. March 2004-April 2004 | |||||||||||||||||||||||||||||||||||
|---|---|---|---|---|---|---|---|---|---|---|---|---|---|---|---|---|---|---|---|---|---|---|---|---|---|---|---|---|---|---|---|---|---|---|---|---|---|---|---|
| The overall turnover | 84 633 | 9.0 | 339 753 | -0.6 | 2.6 | ||||||||||||||||||||||||||||||||||
| Oil and Gas Extraction | 34 165 | 27.5 | 130 499 | 8.4 | 6.9 | ||||||||||||||||||||||||||||||||||
| Manufacturing | 41 371 | -0.8 | 168 262 | 2.4 | -5.2 | ||||||||||||||||||||||||||||||||||
| Electricity, Gas and Steam Supply | 8 421 | -2.6 | 38 520 | -30.4 | 2.3 | ||||||||||||||||||||||||||||||||||
| Main industrial groupings | |||||||||||||||||||||||||||||||||||||||
| Intermediate goods | 16 109 | 12.0 | 64 973 | 14.8 | -3.2 | ||||||||||||||||||||||||||||||||||
| Capital goods | 10 234 | -10.3 | 37 523 | -11.7 | 0.7 | ||||||||||||||||||||||||||||||||||
| Consumer goods | 13 660 | -3.8 | 58 145 | 3.4 | -6.9 | ||||||||||||||||||||||||||||||||||
| Energy goods | 44 629 | 18.5 | 179 110 | -4.0 | 6.8 | ||||||||||||||||||||||||||||||||||
| 1 | NOK million. |
Find more figures
Find detailed figures from Turnover in oil and gas, manufacturing, mining and electricity supply
Additional information
The variation in manufacturing turnover can be related to changes in volume and price indices in different industries and also production to stocks and sales from stocks.
Contact
-
Robert Skotvold
E-mail: robert.skotvold@ssb.no
tel.: (+47) 40 90 24 44
-
Anne Karin Linderud Haugen
E-mail: anne.karin.linderud.haugen@ssb.no
tel.: (+47) 91 88 19 76

