Content
Published:
This is an archived release.
First quarter - increase in manufacturing
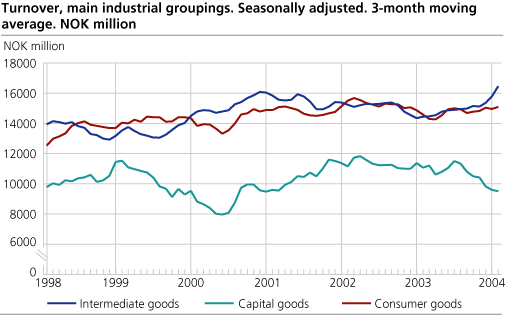
Total turnover in manufacturing amounted to approximately NOK 127 billion in the first quarter of 2004, a 3.5 per cent rise from the same period in 2003. The largest increase is seen within intermediate goods, but also consumer goods experienced improved turnover in this first quarter.
Turnover within Norwegian Oil- and Gas extraction was NOK 96 billion in the first quarter of 2004, up 3 per cent from the same period in 2003. Several companies have given reports of large volumes at high prices in the trading of oil. According to the External merchandise trade statistics, the average price for oil in March 2004 was NOK 238 per barrel compared with NOK 228 in March last year.
Increase in intermediate goods
Turnover within intermediate goods have had a rise of 8.9 per cent compared with the previous quarter. There was growth within basic chemicals, wood and wood products and other non-metallic mineral products, but the largest increase is found within basic metals. The industry has given reports of increased demand for their products and higher prices. A large part of the demand has been covered through sale from stock. The index of production also shows a raise in production within non-ferrous metals.
Increase in capital goods
There has been improvement within capital goods the last three months, but turnover was still lower than in the corresponding period in 2003. This is mostly due to realization of large projects within transport equipment in the first quarter last year. The same trend may also be seen in other industries such as fabricated metal products, machinery and equipment n.e.c and oil platforms and modules.
Consumer goods up
Consumer goods increased by 6 per cent in the first quarter compared to the same period in 2003. Food and food products had the largest growth within the industrial grouping, followed by furniture, other manufacturing and recycling. Textiles, wearing apparel and leather was still in decline.
| Statistics on turnover of oil and gas extraction, mining and quarrying, manufacturing, electricity and gas supply. March 2004 |
| Original series1. March 2004 | Changes in per cent. March 2003-March 2004 | Original series1. January-March 2004 | Changes in per cent. January-March 2003 - January-March 2004 | Seasonally adjusted changes in per cent. February-March 2004 | |||||||||||||||||||||||||||||||||||
|---|---|---|---|---|---|---|---|---|---|---|---|---|---|---|---|---|---|---|---|---|---|---|---|---|---|---|---|---|---|---|---|---|---|---|---|---|---|---|---|
| The overall turnover | 90 238 | 6.8 | 255 120 | -3.4 | -0.4 | ||||||||||||||||||||||||||||||||||
| Oil and gas extraction | 32 235 | 11.5 | 96 334 | 3.0 | 0.8 | ||||||||||||||||||||||||||||||||||
| Manufacturing | 48 703 | 12.9 | 126 891 | 3.5 | 4.6 | ||||||||||||||||||||||||||||||||||
| Electricity, gas and steam supply | 8 610 | -27.7 | 30 099 | -35.6 | -4.9 | ||||||||||||||||||||||||||||||||||
| Main industrial groupings | |||||||||||||||||||||||||||||||||||||||
| Intermediate goods | 18 561 | 25.0 | 48 864 | 15.7 | 3.6 | ||||||||||||||||||||||||||||||||||
| Capital goods | 11 177 | 0.6 | 27 289 | -12.2 | 3.6 | ||||||||||||||||||||||||||||||||||
| Consumer goods | 16 743 | 15.8 | 44 485 | 5.9 | 5.3 | ||||||||||||||||||||||||||||||||||
| Energy goods | 43 757 | -0.7 | 134 481 | -9.7 | -3.2 | ||||||||||||||||||||||||||||||||||
| 1 | NOK million. |
Find more figures
Find detailed figures from Turnover in oil and gas, manufacturing, mining and electricity supply
Additional information
The variation in manufacturing turnover can be related to changes in volume and price indices in different industries and also production to stocks and sales from stocks.
Contact
-
Robert Skotvold
E-mail: robert.skotvold@ssb.no
tel.: (+47) 40 90 24 44
-
Anne Karin Linderud Haugen
E-mail: anne.karin.linderud.haugen@ssb.no
tel.: (+47) 91 88 19 76

