Content
Published:
This is an archived release.
Slow start for machinery and equipment
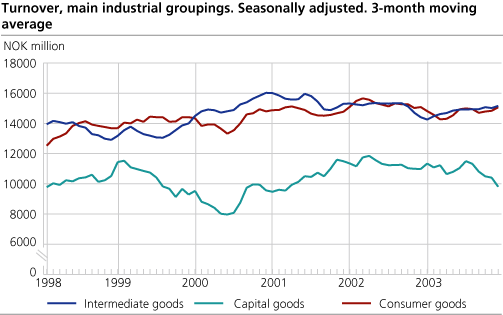
Turnover in Norwegian manufacturing was NOK 38.5 billion in January 2004. This is a minor decline from January 2003. Increased turnover within intermediate- and consumer goods subdued the decline within manufacturing, while the trend for capital goods was increasingly negative.
From December to January turnover within manufacturing experienced a slight increase of 0.8 per cent. Consumer goods have had a stable growth in turnover the last three months and intermediate goods have turned a negative trend to a positive one. Capital goods, on the other hand, experienced a marked decrease in turnover, falling 14.7 per cent from December.
Strong fall for capital goods
Lower turnover within capital goods was mainly a result of a decrease within oil platforms and modules and machinery and equipment. Machinery and equipment has been in a continued decline since august 2003. New orders within this industry, however, show a marked increase, and this can generate an improvement in turnover in the coming months. (Read more: Statistics on new orders. Manufacturing, 4th quarter 2003 )
Intermediate goods up 3.6 per cent
All industries within intermediate goods (pulp, paper and paper products, basic chemicals and basic metals a.o.) experienced increased turnover from December to January, according to seasonally adjusted figures. Pulp, paper and paper products showed growth throughout the last six months of 2003, and the level of turnover has been stable since November 2003. Non-ferrous metals also entered the year with increased turnover.
Consumer goods up 3.5 per cent
Increased turnover within food products was the main contributor to the raise within consumer goods from December to January. However, other industries within the main industrial grouping also experienced growth from December to January, according to seasonally adjusted figures.
|
Statistics on turnover of oil and gas extraction, mining and quarrying, manufacturing, electricity
and gas supply. January 2004 |
|
Original series
January 2004 |
Changes in per cent
January 2003- January 2004 |
Original series1 January-January 2004 |
Changes in per cent
January-January 2003- January-January 2004 |
Seasonally adjusted
changes in per cent December 2003- January2004 |
|||||||||||||||||||||||||||||||||||
|---|---|---|---|---|---|---|---|---|---|---|---|---|---|---|---|---|---|---|---|---|---|---|---|---|---|---|---|---|---|---|---|---|---|---|---|---|---|---|---|
| The overall turnover | 81 890 | -7.9 | 81 890 | -7.9 | 4.1 | ||||||||||||||||||||||||||||||||||
| Oil and Gas Extraction | 30 426 | -6.4 | 30 426 | -6.4 | 4.4 | ||||||||||||||||||||||||||||||||||
| Manufacturing | 38 439 | -3.3 | 38 439 | -3.3 | 0.8 | ||||||||||||||||||||||||||||||||||
| Electricity, Gas and Steam Supply | 12 477 | -23.1 | 12 477 | -23.1 | 1.8 | ||||||||||||||||||||||||||||||||||
| Main industrial groupings | |||||||||||||||||||||||||||||||||||||||
| Intermediate goods | 14 953 | 4.7 | 14 953 | 4.7 | 3.6 | ||||||||||||||||||||||||||||||||||
| Capital goods | 7 173 | -23.1 | 7 173 | -23.1 | -14.7 | ||||||||||||||||||||||||||||||||||
| Consumer goods | 14 229 | 0.0 | 14 229 | 0.0 | 3.5 | ||||||||||||||||||||||||||||||||||
| Energy goods | 45 534 | -10.8 | 45 534 | -10.8 | 12.1 | ||||||||||||||||||||||||||||||||||
| 1 | NOK million. |
Find more figures
Find detailed figures from Turnover in oil and gas, manufacturing, mining and electricity supply
Additional information
The variation in manufacturing turnover can be related to changes in volume and price indices in different industries and also production to stocks and sales from stocks.
Contact
-
Robert Skotvold
E-mail: robert.skotvold@ssb.no
tel.: (+47) 40 90 24 44
-
Anne Karin Linderud Haugen
E-mail: anne.karin.linderud.haugen@ssb.no
tel.: (+47) 91 88 19 76