Content
Published:
This is an archived release.
Stable turnover in manufacturing
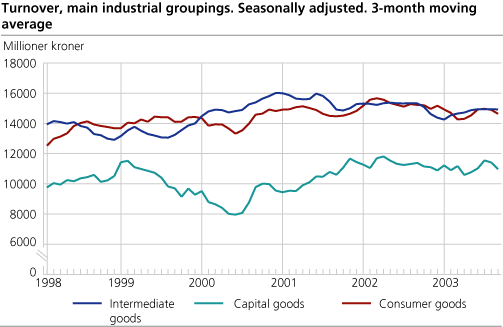
Total turnover in Norwegian manufacturing was approximately NOK 47 billion in October - a slight decline of 0.7 per cent compared with October 2002. According to seasonally adjusted figures, the total turnover increased by 0.1 cent from September to October.
Capital goods experienced the greatest change with an increase of 1.4 per cent from September to October this year. This rise was mainly due to the transport equipment industry, which, after a weak September month, experienced an increase in October. A decrease in the turnover within fabricated metal products and oil platforms and modules prevented further increase within this industrial grouping.
Intermediate goods stable
Figures for intermediate goods in October show a slight decrease compared with September. Basic chemicals and non-ferrous metals show a substantial increase in turnover from last month, with 13.8 per cent and 10.9 per cent, respectively. There has been noted an increase in both price and production within these areas of industry in October 2003. This positive growth within some intermediate goods was, however, somewhat held back by the negative development within industries such as pulp, paper and paper products and other non-metallic mineral products.
Consumer goods remain unchanged
Within consumer goods, figures for October show no considerable changes in turnover from September, a mere decline of 0.2 per cent. Food and food products experienced the largest decline, 1.9 per cent. Furniture and other manufacturing experienced a slight decrease of 0.2 per cent, whilst publishing, printing and reproduction had a slight increase of 0.4 per cent.
Oil- and gas extraction down
Norwegian oil and gas extraction experienced a total turnover of NOK 28 billion in October this year, a decrease of 2.6 per cent compared to same period last year. This decline is due to a slightly lower production in October 2003 compared with the same month last year. The production of gas, however, experienced a higher production in October this year.
| Statistics on turnover of oil and gas extraction, mining and quarrying, manufacturing, electricity and gas supply. October 2003 |
| Original series1October 2003 | Changes in per cent October 2002-October 2003 | Original series1January-October 2003 | Changes in per cent January-October 2002 - January-October 2003 | Seasonally adjusted changes in per cent September-October 2003 | |||||||||||||||||||||||||||||||||||
|---|---|---|---|---|---|---|---|---|---|---|---|---|---|---|---|---|---|---|---|---|---|---|---|---|---|---|---|---|---|---|---|---|---|---|---|---|---|---|---|
| The overall turnover | 85 850 | 0.3 | 818 490 | 3.7 | -1.0 | ||||||||||||||||||||||||||||||||||
| Oil and Gas Extraction | 28 126 | -2.6 | 289 014 | 0.6 | -6.5 | ||||||||||||||||||||||||||||||||||
| Manufacturing | 46 772 | -0.7 | 421 495 | -2.2 | 0.1 | ||||||||||||||||||||||||||||||||||
| Electricity, Gas and Steam Supply | 10 336 | 20.0 | 102 644 | 60.6 | 1.7 | ||||||||||||||||||||||||||||||||||
| Main industrial groupings | |||||||||||||||||||||||||||||||||||||||
| Intermediate goods | 17 294 | -0.5 | 148 688 | -3.3 | -0.6 | ||||||||||||||||||||||||||||||||||
| Capital goods | 10 869 | -5.9 | 106 313 | -3.5 | 1.4 | ||||||||||||||||||||||||||||||||||
| Consumer goods | 16 756 | -2.4 | 146 646 | -4.3 | -0.2 | ||||||||||||||||||||||||||||||||||
| Energy goods | 40 930 | 3.6 | 416 841 | 12.0 | -3.3 | ||||||||||||||||||||||||||||||||||
| 1 | NOK Million. |
Find more figures
Find detailed figures from Turnover in oil and gas, manufacturing, mining and electricity supply
Additional information
The variation in manufacturing turnover can be related to changes in volume and price indices in different industries and also production to stocks and sales from stocks.
Contact
-
Robert Skotvold
E-mail: robert.skotvold@ssb.no
tel.: (+47) 40 90 24 44
-
Anne Karin Linderud Haugen
E-mail: anne.karin.linderud.haugen@ssb.no
tel.: (+47) 91 88 19 76

