Content
Published:
This is an archived release.
Manufacturing still in decline
The total turnover within manufacturing was approximately NOK 39 billion in February, a 1.9 per cent drop compared with February last year. Food and food products and basic chemicals are the main contributors to the decline.
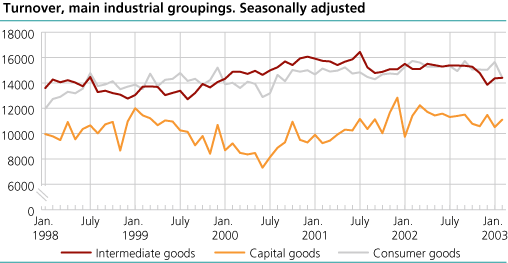
Industries that produce intermediate goods - pulp, paper and paper products, basic chemicals and basic metals - show a decline in the average turnover in the period December to February compared with the same figure in the previous three-month period. The drop is mainly caused by lower turnover in basic chemicals. Month-on-month figures, however, show a slight increase for intermediate goods from January to February.
Capital goods improving
Capital goods - transport equipment, fabricated metal products and machinery and equipment a.o. - experienced a weaker turnover in February this year compared with the same month last year. Seasonally adjusted figures on the other hand, display a higher average turnover in the period December to February than in the previous three-month period. There was also a growth in turnover for capital goods from January to February. The positive tendencies are mainly led by increased turnover within transport equipment. It is, however, important to keep in mind that this is an industry with fluctuating turnover due to realization of large projects.
Drop in turnover for consumer goods
Turnover of consumer goods - food and food products, textiles, wearing apparel and leather and publishing, printing and reproduction a.o. - dropped 8 per cent in February compared with February last year, according to unadjusted figures. Food and food products experience the strongest decline, mainly caused by a steep fall in turnover for the production and preservation of fish and fish products.
Oil and gas extraction
Turnover within Norwegian oil- and gas extraction was approximately NOK 32 billion in February, 21.9 per cent higher than the same month last year. Several companies have given reports of large volumes at high prices in the trading of oil. According to the External merchandise trade statistics, the average price for oil in February was NOK 232 per barrel, a price which is more than 30 per cent higher than the price in February last year. Turnover within gas extraction was at a lower level in February this year compared with February last year, mostly due to lower gas prices.
Electricity, gas and steam supply
Long-term financial contracts influence the level in turnover within electricity, gas and steam supply. It is therefore advised to interpret figures with caution.
| Statistics on turnover of oil and gas extraction, mining and quarrying, manufacturing, electricity and gas supply. February 2003 |
| Original series1 | Changes in per cent | Seasonally adjusted changes in per cent | |||||||||||||||||||||||||||||||||||||
|---|---|---|---|---|---|---|---|---|---|---|---|---|---|---|---|---|---|---|---|---|---|---|---|---|---|---|---|---|---|---|---|---|---|---|---|---|---|---|---|
| February 2003 | February 2002-February 2003 | November 2002-December 2002 | December 2002-January 2003 | January 2002-February 2003 | |||||||||||||||||||||||||||||||||||
| The overall turnover | 84 320 | 14.2 | 10.8 | 2.7 | 1.3 | ||||||||||||||||||||||||||||||||||
| Oil and Gas Extraction | 32 096 | 21.9 | 13.6 | 10.2 | 7.1 | ||||||||||||||||||||||||||||||||||
| Manufacturing | 39 173 | -1.9 | 1.1 | 1.4 | -0.1 | ||||||||||||||||||||||||||||||||||
| Electricity, Gas and Steam Supply | 12 645 | 82.3 | 41.0 | -18.7 | -7.0 | ||||||||||||||||||||||||||||||||||
| Main industrial groupings | |||||||||||||||||||||||||||||||||||||||
| Intermediate goods | 13 175 | -5.1 | -6.3 | 3.7 | 0.3 | ||||||||||||||||||||||||||||||||||
| Capital goods | 9 899 | -3.3 | 8.4 | -8.4 | 5.6 | ||||||||||||||||||||||||||||||||||
| Consumer goods | 13 419 | -8.4 | -0.1 | 4.1 | -8.0 | ||||||||||||||||||||||||||||||||||
| Energy goods | 47 827 | 36.4 | 19.6 | 6.7 | 4.3 | ||||||||||||||||||||||||||||||||||
| 1 | Million NOK. |
Find more figures
Find detailed figures from Turnover in oil and gas, manufacturing, mining and electricity supply
Additional information
The variation in manufacturing turnover can be related to changes in volume and price indices in different industries and also production to stocks and sales from stocks.
Contact
-
Robert Skotvold
E-mail: robert.skotvold@ssb.no
tel.: (+47) 40 90 24 44
-
Anne Karin Linderud Haugen
E-mail: anne.karin.linderud.haugen@ssb.no
tel.: (+47) 91 88 19 76