Content
Published:
This is an archived release.
Manufacturing decline curbs energy use growth
The total energy consumption in 2012 was at about the same level as in the previous year. However, there were significant differences in the development in energy consumption for different consumer groups.
| All energy products | Change in per cent | ||
|---|---|---|---|
| 2011 | 2012 | 2011 - 2012 | |
| Corrected 6 December 2013. | |||
| 1.1 Primary energy production | 8 328 | 8 588 | 3.1 |
| 2 Imports | 296 | 284 | -4.1 |
| 3 Exports | 7 429 | 7 673 | 3.3 |
| 6 Total energy supply | 1 138 | 1 149 | 1.0 |
| 12 Final consumption including non-energy use | 856 | 855 | -0.2 |
| 13 Manufacturing, mining and quarrying | 250 | 241 | -3.5 |
| 14 Transport | 206 | 207 | 0.9 |
| 15 Other sectors | 323 | 332 | 2.8 |
| 16 Non energy use | 79 | 74 | -5.3 |
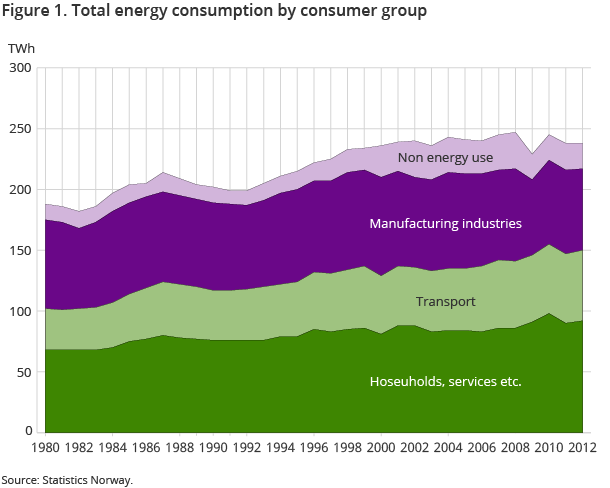
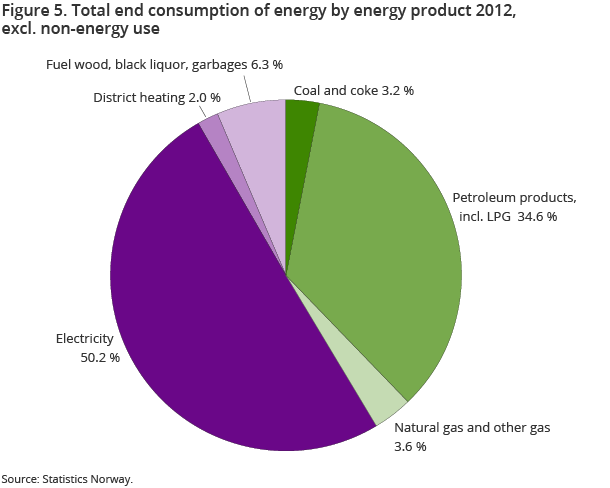
Total energy consumption in 2012, excluding non-energy use, rose by 0.3 per cent from the previous year. There was a decrease in energy used as raw materials in the industry, and if energy used as raw materials is included, the total energy use shows a slight decrease of 0.2 per cent from 2011.
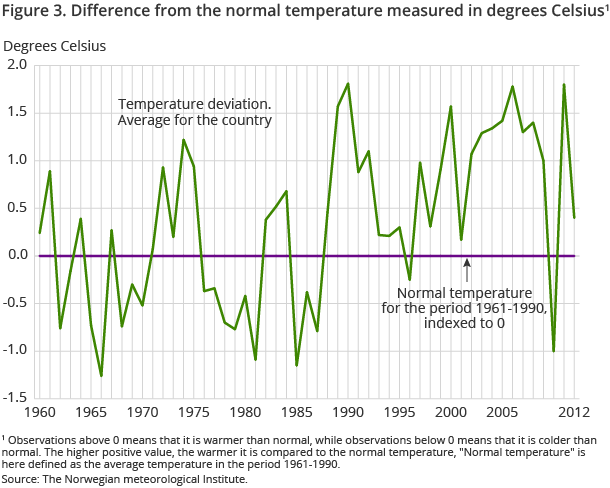
Energy consumption in households and services rose by about 3 and 2 per cent respectively from the previous year. This is partly due to colder weather. The average temperature for Norway as a whole was 1.4 degrees lower in 2012 than the year before.
Shut-downs in manufacturing industries resulted in lower energy consumption
Energy consumption in manufacturing fell by almost 4 per cent from the year before. The decrease can be explained by shut-downs or outages in several large companies in energy-intensive industries during 2012. The largest decrease in energy consumption was in the pulp and paper industry, with a reduction of more than 20 per cent from 2011. There was also a decrease of around 3 per cent in energy consumption for the chemical industry and iron, steel and ferro-alloys from 2011. The pulp and paper, chemical and metal industries are regarded as energy-intensive industries in Norway. These industries account for 80 per cent of electricity consumption and about 70 per cent of total energy consumption in industry. Closures and breakdowns in companies in these industries therefore have a major impact on the total energy use in industry. Consumption in total manufacturing industries accounts for about 30 per cent of the total energy consumption in Norway.
Cold weather and lower electricity prices resulted in more use of power...
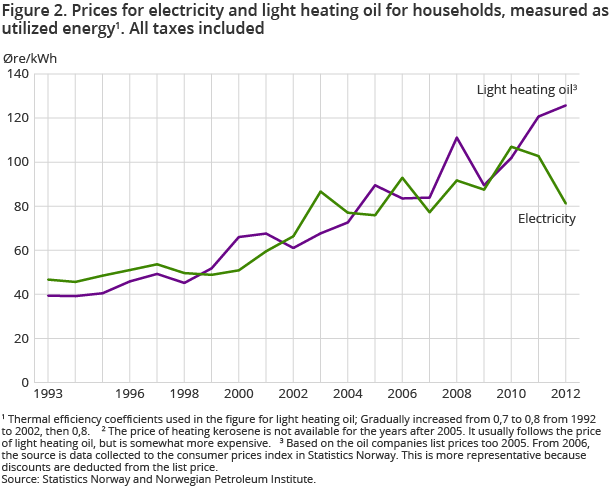
The total consumption of electricity in Norway rose by just over 1 per cent from 2011 to 2012. Electricity is the main energy product in Norway and accounts for about 50 per cent of total domestic energy consumption, and about 70-80 per cent of consumption in households and services. High electricity production led to a drop in energy prices in 2012. The total price of electricity for households, including taxes and tariffs, averaged 81.2 øre/kWh in 2012. This is about NOK 0.22 less than in 2011. There was also a decline in the price of electricity for the manufacturing and service sectors.
While the use of heating oils declined...
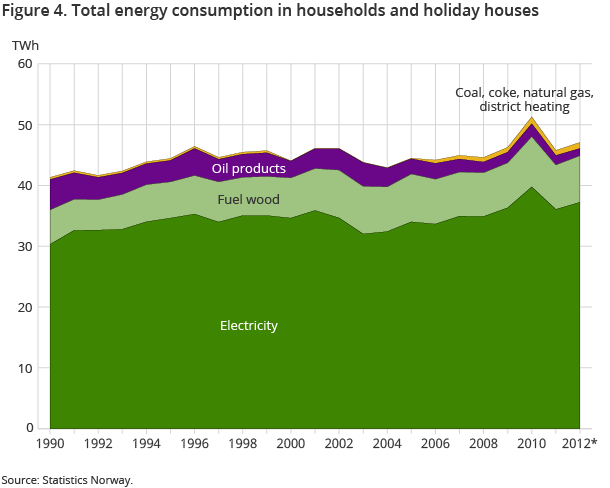
While electricity prices dropped, the price of heating oil rose. In 2012, the cost of a litre of heating oil averaged NOK 10.11, which is NOK 0.41 more than in 2011. The development in energy prices in 2012 made it more beneficial to use electricity. While the use of heating oil and kerosene declined significantly in households in 2012, consumption of electricity rose by about 3 per cent from the year before. There was also a significant increase in the use of district heating in households, at around 20 per cent. Nevertheless, district heating only makes up about 2 per cent of total household energy consumption .
Higher wood consumption by households but less use of biomass in industry
Just under 1.5 million tonnes was burned by Norwegian households in 2012. In addition, 150 000 tonnes were burned in holiday homes. Wood consumption in households was 10 per cent higher in 2012 than the year before. More than half of all the wood that was burned in households in 2012 was burned in enclosed stoves with new technology (stoves manufactured after 1998). Stoves with new technology are more energy efficient than ovens with old technology, and they emit less particulate matter. Forty-four per cent of the wood was burned in a closed furnace with old technology, while 4 per cent of the wood was burned in open fireplaces.
For Norway as a whole, however, the use of bioenergy (wood, pellets, bark, wood chips, wood waste and black liquor) in 2012 decreased by 8 per cent compared with the previous year due to the development in the manufacturing industry. The manufacturers in wood processing are the largest consumers in the bioenergy industry. Closures and production shutdowns in the pulp and paper industry contributed to a decrease in bioenergy in manufacturing industries of 25 per cent from the year before.
Increased energy use for transport
Energy use for transport rose by about 1 per cent from the previous year. Energy consumption rose mostly in air and road transport, by 1.7 and 1.4 per cent respectively, while there was a slight decrease in consumption in coastal transport. There has been a trend towards decreased use of gasoline and increased use of diesel, and this trend continued in 2012. While the use of gasoline in road transport decreased by 7 per cent, the use of diesel rose by about 5 per cent.
The statistics is now published as Production and consumption of energy, energy balance and energy account.
Additional information
The statistics are published in spring and autumn. The spring publication is preliminary and aggregated to a larger degree, and only includes figures for energy balance. In the autumn publication, tables are also presented for the energy accounts.
Contact
-
Statistics Norway's Information Centre
E-mail: informasjon@ssb.no
tel.: (+47) 21 09 46 42
