Content
Published:
This is an archived release.
High electricity production
Electricity production came to 10 904 GWh in September 2012. This is 4.6 per cent higher than in September last year.
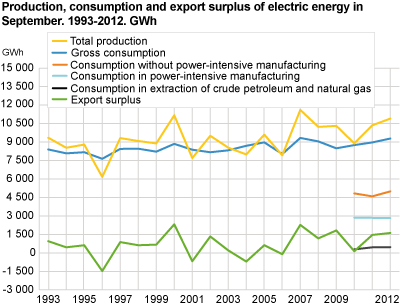
The high electricity generation may be seen in conjunction with a large amount of water in the Norwegian reservoirs. According to the Norwegian Water Resources and Energy Directorate, the reservoir filling was 88.1 per cent at the beginning of September. At the end of the month in week 39 the filling was 91.1 per cent. This is 5 percentage points higher than the same week in 2011 and 4.5 percentage points higher than the median filling for the corresponding week in the years 1990-2011.
High net export of power
Norway’s export of power totalled 1 683 GWh in September 2012, whereas imports came to 65 GWh. This gave a net export of 1 618 GWh. In the same month last year the net export totalled 1 460 GWh. Exchange of power between countries is determined by differences in generation and the consumption situation and prices, in addition to the capacity of the power lines. The high net export can be seen in conjunction with the large volume of water in the Norwegian power system.
Rise in the total electricity consumption
The total gross consumption of electricity came to 9 286 GWh in September, an increase of 3.5 per cent compared with the same month in 2011. The gross consumption of electricity encompasses consumption in the groups extraction of crude oil and natural gas, power-intensive manufacturing and
electricity consumption excluding power-intensive manufacturing and extraction. Net loss, pump storage use and other own consumption in the power stations are also included.
Increase in the electricity consumption excluding power-intensive manufacturing and extraction
Electricity consumption excluding power-intensive manufacturing and extraction amounted to 4 995 GWh in September 2012, an increase of 8.8 per cent compared with the same month in 2011. This may be seen in conjunction with a 2.6 degrees lower average temperature for Norway as a whole in September this year compared to the same month last year. Households, services and manufacturing other than the power-intensive manufacturing account for the majority of the electricity consumption excluding power-intensive manufacturing and extraction. Electricity consumption in households amounts to approximately 50 per cent of the electricity consumption excluding power-intensive manufacturing and extraction.
Small decrease in the consumption in power-intensive manufacturing
Electricity consumption in power-intensive manufacturing was 2 824 GWh in September 2012. This is 0.7 per cent lower compared with September 2011. The decline may be seen in conjunction with closures of some wood processing establishments. Power-intensive manufacturing utilises electricity for the production of goods. Hence, the electricity consumption is not influenced by temperature.
| Twelve-month periods | January-September | September | |||||||||||||||||||||||||||||||||||||||||||||||||||||||||||||||||||||||||||||
|---|---|---|---|---|---|---|---|---|---|---|---|---|---|---|---|---|---|---|---|---|---|---|---|---|---|---|---|---|---|---|---|---|---|---|---|---|---|---|---|---|---|---|---|---|---|---|---|---|---|---|---|---|---|---|---|---|---|---|---|---|---|---|---|---|---|---|---|---|---|---|---|---|---|---|---|---|---|---|---|
|
October 2010-
September 2011 |
October 2011-
September 2012 |
Change in
per cent |
2011 | 2012 |
Change in
per cent |
2011 | 2012 |
Change in
per cent |
|||||||||||||||||||||||||||||||||||||||||||||||||||||||||||||||||||||||
| Total production | 127 471 | 146 992 | 15.3 | 89 873 | 108 721 | 21.0 | 10 429 | 10 904 | 4.6 | ||||||||||||||||||||||||||||||||||||||||||||||||||||||||||||||||||||||
| Hydro power | 121 096 | 142 171 | 17.4 | 85 124 | 105 215 | 23.6 | 10 059 | 10 521 | 4.6 | ||||||||||||||||||||||||||||||||||||||||||||||||||||||||||||||||||||||
| Thermal power | 5 193 | 3 343 | -35.6 | 3 881 | 2 452 | -36.8 | 261 | 244 | -6.3 | ||||||||||||||||||||||||||||||||||||||||||||||||||||||||||||||||||||||
| Wind power | 1 181 | 1 478 | 25.2 | 868 | 1 053 | 21.3 | 109 | 139 | 27.0 | ||||||||||||||||||||||||||||||||||||||||||||||||||||||||||||||||||||||
| Import | 13 290 | 3 103 | -76.7 | 9 996 | 1 845 | -81.5 | 361 | 65 | -82.0 | ||||||||||||||||||||||||||||||||||||||||||||||||||||||||||||||||||||||
| Export | 11 450 | 23 186 | 102.5 | 8 911 | 17 768 | 99.4 | 1 821 | 1 683 | -7.6 | ||||||||||||||||||||||||||||||||||||||||||||||||||||||||||||||||||||||
| Gross domestic consumption | 129 311 | 126 909 | -1.9 | 90 959 | 92 797 | 2.0 | 8 969 | 9 286 | 3.5 | ||||||||||||||||||||||||||||||||||||||||||||||||||||||||||||||||||||||
| Pump storage use and other own consumption | 2 104 | 2 367 | 12.5 | 1 911 | 1 867 | -2.3 | 316 | 271 | -14.5 | ||||||||||||||||||||||||||||||||||||||||||||||||||||||||||||||||||||||
| Calculated net loss | 10 502 | 11 025 | 5.0 | 7 344 | 8 077 | 10.0 | 766 | 785 | 2.5 | ||||||||||||||||||||||||||||||||||||||||||||||||||||||||||||||||||||||
| Net consumption of electricity | 116 704 | 113 516 | -2.7 | 81 705 | 82 853 | 1.4 | 7 887 | 8 231 | 4.4 | ||||||||||||||||||||||||||||||||||||||||||||||||||||||||||||||||||||||
| Consumption in extraction of crude petroleum and natural gas | 5 334 | 6 084 | 14.0 | 3 860 | 4 537 | 17.5 | 452 | 412 | -8.9 | ||||||||||||||||||||||||||||||||||||||||||||||||||||||||||||||||||||||
| Total consumption in power-intensive manufacturing. | 34 728 | 34 451 | -0.8 | 25 921 | 25 721 | -0.8 | 2 844 | 2 824 | -0.7 | ||||||||||||||||||||||||||||||||||||||||||||||||||||||||||||||||||||||
| Non-priority consumption | 1 530 | 1 779 | 16.3 | 1 236 | 1 408 | 13.9 | 127 | 160 | 26.7 | ||||||||||||||||||||||||||||||||||||||||||||||||||||||||||||||||||||||
| Priority power | 33 198 | 32 672 | -1.6 | 24 685 | 24 313 | -1.5 | 2 717 | 2 664 | -2.0 | ||||||||||||||||||||||||||||||||||||||||||||||||||||||||||||||||||||||
| consumption in pulp and paper production | 4 025 | 3 584 | -11.0 | 2 877 | 2 577 | -10.4 | 339 | 270 | -20.2 | ||||||||||||||||||||||||||||||||||||||||||||||||||||||||||||||||||||||
| Production of chemical commodity | 6 291 | 5 931 | -5.7 | 4 594 | 4 446 | -3.2 | 468 | 493 | 5.4 | ||||||||||||||||||||||||||||||||||||||||||||||||||||||||||||||||||||||
| Production of iron, steel and ferroalloy | 4 296 | 4 463 | 3.9 | 3 288 | 3 318 | 0.9 | 373 | 362 | -3.0 | ||||||||||||||||||||||||||||||||||||||||||||||||||||||||||||||||||||||
| Production of aluminium and other metals | 18 586 | 18 694 | 0.6 | 13 927 | 13 972 | 0.3 | 1 537 | 1 538 | 0.1 | ||||||||||||||||||||||||||||||||||||||||||||||||||||||||||||||||||||||
| Consumption without power-intensive manufacturing and extraction | 76 642 | 72 982 | -4.8 | 51 923 | 52 596 | 1.3 | 4 591 | 4 995 | 8.8 | ||||||||||||||||||||||||||||||||||||||||||||||||||||||||||||||||||||||
Contact
-
Magne Holstad
E-mail: magne.holstad@ssb.no
tel.: (+47) 40 90 23 42
-
Ingvild Røstøen Ruen
E-mail: ingvild.ruen@ssb.no
tel.: (+47) 40 81 13 97
-
Tom Jonas Billit
E-mail: tom.billit@ssb.no
tel.: (+47) 40 81 13 45
-
Thomas Aanensen
E-mail: thomas.aanensen@ssb.no
tel.: (+47) 40 90 23 48