Content
Published:
This is an archived release.
All time high net exports
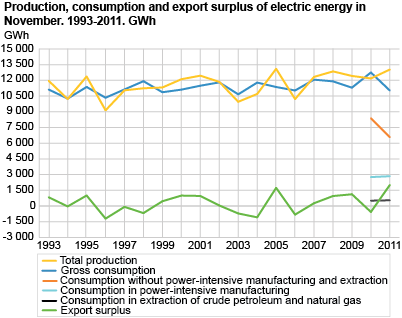
Export of electricity came to 2 171 GWh in November, while imports totalled 162 GWh. This gave a net export of 2 009 GWh; the highest level ever recorded for November since the monthly electricity statistics started in 1979.
Exchange of power between countries is determined by differences in generation and the consumption situation and prices, in addition to the capacity of the power lines. The all time high net export may be due to the fact that the large volume of water in the Norwegian power system and low domestic consumption contributed to a lower average elspot price in November for the Norwegian price areas compared with the other Nordic areas.
Very high generation of electricity
Total electricity generation came to 13 033 GWh in November 2011. This is an increase of 7 per cent compared with the same month in 2010 and the second highest figure ever recorded for this month. The electricity generation can be viewed in conjunction with the large inflow of water and risk of overflow in many reservoirs. When there is a risk of overflow it is more profitable to produce power and sell it at a low price than to lose valuable water.
Decrease in the degree of filling
According to the Norwegian Water Resources and Energy Directorate, the reservoir filling was 88.0 per cent at the beginning of November. Throughout the month, the filling fell by 2.9 percentage points to 85.1 per cent at the end of week 47. For the individual elspot areas, the degree of filling varied from 82.4 to 88.6 per cent. The median filling for the corresponding week in the years 1990-2007 is 82.8 per cent.
Record high temperature behind low electricity consumption excluding power-intensive manufacturing and extraction
Electricity consumption excluding power-intensive manufacturing and extraction amounted to 6 562 GWh in November 2011. This is 22 per cent lower compared with the same month in 2010. An important explanatory variable of the electricity consumption excluding power-intensive manufacturing and extraction is temperature. This is due to the fact that much of this electricity consumption is used for heating. Hence, the decline may be seen in conjunction with a considerably higher average temperature for Norway as a whole in November 2011 compared with the same month in the previous year. Households, services and manufacturing other than the power intensive manufacturing account for the majority of the electricity consumption excluding power-intensive manufacturing and extraction. The electricity consumption in households amounts to approximately 50 per cent of the electricity consumption excluding power-intensive manufacturing and extraction.
Increase in electricity consumption in power-intensive manufacturing
Electricity consumption in power-intensive manufacturing was 2 844 GWh in November. This is 3 per cent higher compared with November 2010. The index of production for manufacturing shows a decline in the production of the power-intensive industries in the same period. The difference in the development in production and consumption is partly due to the fact that the index of production encompasses heterogeneous products that require different volumes of electricity.
Tables:
Contact
-
Magne Holstad
E-mail: magne.holstad@ssb.no
tel.: (+47) 40 90 23 42
-
Ingvild Røstøen Ruen
E-mail: ingvild.ruen@ssb.no
tel.: (+47) 40 81 13 97
-
Tom Jonas Billit
E-mail: tom.billit@ssb.no
tel.: (+47) 40 81 13 45
-
Thomas Aanensen
E-mail: thomas.aanensen@ssb.no
tel.: (+47) 40 90 23 48