Content
Published:
This is an archived release.
Record high general consumption
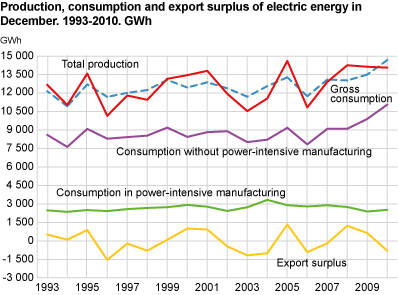
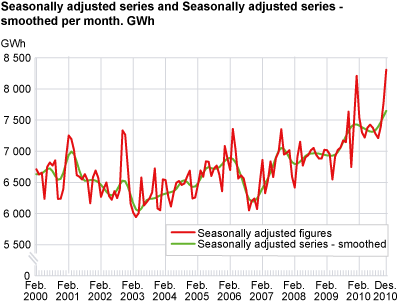
Electricity consumption excluding power-intensive manufacturing amounted to 91.2 TWh in 2010. This is 7.7 per cent higher compared with 2009, and the highest level ever recorded.
Even though electricity prices increased from 2009 to 2010, consumption excluding power-intensive manufacturing was higher in 2010 compared to the year before. The record high consumption must be seen in conjunction with the low temperatures in 2010. The average temperature in Norway was 1 degree below normal and 2 degrees lower in 2010 compared to the year before.
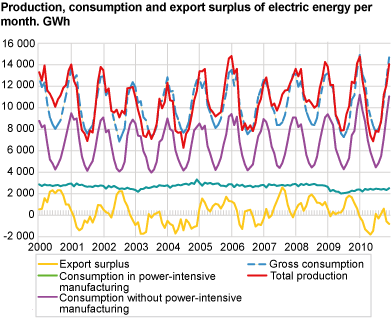
In December 2010, consumption excluding power-intensive manufacturing amounted to 11 068 GWh. This is 11.8 per cent higher compared to the same month in 2009. The average temperature in December 2010 was 4.7 degrees lower than the same month the year before. Households, services and manufacturing other than the power-intensive account for the majority of the electricity consumption excluding power-intensive manufacturing. Much of this electricity is used for heating. The total electricity consumption of households accounts for less than 50 per cent of the annual consumption within general supply.1
Higher electricity consumption in power-intensive manufacturing
Electricity consumption in power-intensive manufacturing came to 28.9 TWh in 2010. This is 7.4 per cent higher compared to 2009, when the demand for products produced by power-intensive manufacturing fell due to the financial crisis. Consumption in 2010 was still 23.5 per cent lower than the average in the 2000-2008 period. Electricity consumption in power-intensive manufacturing in December came to 2 522 GWh; 5.4 per cent higher compared to the same month in 2009.
Lower electricity production
The production of electricity amounted to 124.4 TWh in 2010. This is 6.3 per cent lower compared to 2009. Of the total production, hydro power accounted for nearly 95 per cent, while thermal power and wind power accounted for 4.5 and 0.7 per cent respectively. According to NVE, the utilisable reservoir inflow amounted to 100.6 TWh in 2010. This is 21.9 TWh lower than normal, and 24.3 TWh below the 2009 level. In all the weeks of 2010 the reservoir level was lower than the median level. At the end of week 52 the reservoir level was 26.3 percentage points below the median level for this week.
Thermal power production came to 5.6 TWh in 2010; 17.8 per cent higher than compared to the year before. For the first time there was a considerable reduction in wind power production. In 2010, wind power totalled 870 GWh; 11.3 per cent lower compared to 2009.
In December 2010, the production of electricity amounted to 14 066 GWh. This is just 0.5 per cent lower than in the same month in 2009.
Net imports of power in 2010
Norway’s imports of electricity came to 14.7 TWh in 2010, while exports totalled 7.1 TWh. This gave net imports of 7.6 TWh. By comparison, there was a net export of 9.0 TWh in 2009.
In December 2010, Norway’s imports of electricity came to 1 340 GWh, while exports totalled 539 GWh. This gave net imports of 801 GWh.
| 1Sentence added 15 February 2011 at 13.35 pm |
Tables:
Contact
-
Magne Holstad
E-mail: magne.holstad@ssb.no
tel.: (+47) 40 90 23 42
-
Ingvild Røstøen Ruen
E-mail: ingvild.ruen@ssb.no
tel.: (+47) 40 81 13 97
-
Tom Jonas Billit
E-mail: tom.billit@ssb.no
tel.: (+47) 40 81 13 45
-
Thomas Aanensen
E-mail: thomas.aanensen@ssb.no
tel.: (+47) 40 90 23 48


