Content
Published:
This is an archived release.
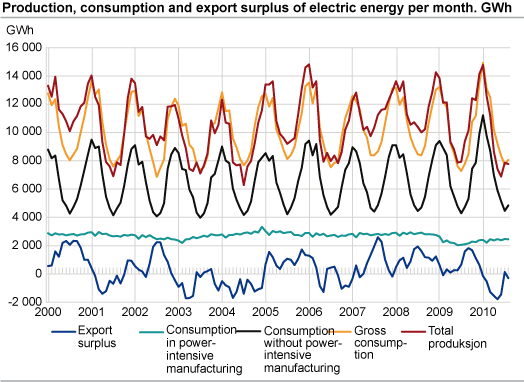
Lower power production
The production of electricity amounted to 7 769 GWh in August, 19 per cent lower than the corresponding month last year. Lower inflow of water to the reservoirs and lower reservoir level in August 2010 may have contributed to the decrease.
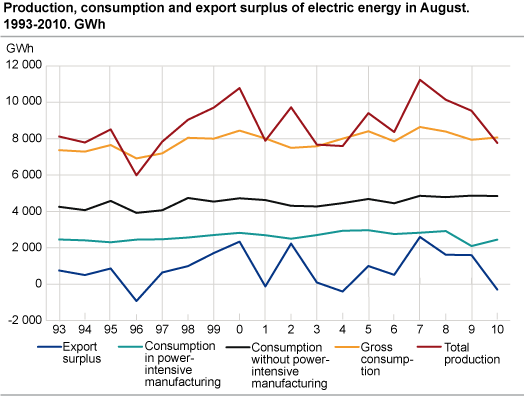
According to NVE (the Norwegian Water Resources and Energy Directorate) the reservoir level was 67.6 per cent at the end of week 34. This is 16.8 percentage points below the median level for week 30, and 13.3 percentage points below the level in the corresponding week in 2009.
So far this year it has been produced 77.2 TWh, a decline of 7 per cent compared with the corresponding period last year. Hydro-, thermal- and wind power account for 94.4, 4.9 and 0.7 per cent respectively of the total production until now.
Net imports of power
Norway’s exports of electricity came to 627 GWh in August, while electricity imports totalled 926 GWh. This gave net imports of 299 GWh. So far this year net imports amount to 6.9 TWh.
Increase in the electricity consumption in power-intensive manufacturing since August 2009
Electricity consumption in power-intensive manufacturing amounted to 2 450 GWh in August, 17 per cent higher than the corresponding month in 2009. The power-intensive manufacturing continuously utilizes electricity in their production. Hence, temperatures do not influence the electricity consumption in power-intensive manufacturing. Electricity consumption in the production of chemical commodities and iron, steel and ferroalloy increased by 57 and 52 per cent respectively, while consumption in production of aluminium increased by 1 per cent compared to the same month last year. Compared with the previous month, the electricity consumption in power-intensive manufacturing was roughly the same.
Electricity consumption excluding power-intensive manufacturing
Electricity consumption excluding power-intensive manufacturing amounted to 4 848 GWh in August, a decrease of 0.4 per cent compared with the corresponding month last year. So far this year the consumption amounts to 57.4 TWh, 7 per cent higher than the same period in 2009. Households, services and manufacturing other than the power-intensive accounted for the majority of the consumption, where much of the electricity is used for heating.
Tables:
Contact
-
Magne Holstad
E-mail: magne.holstad@ssb.no
tel.: (+47) 40 90 23 42
-
Ingvild Røstøen Ruen
E-mail: ingvild.ruen@ssb.no
tel.: (+47) 40 81 13 97
-
Tom Jonas Billit
E-mail: tom.billit@ssb.no
tel.: (+47) 40 81 13 45
-
Thomas Aanensen
E-mail: thomas.aanensen@ssb.no
tel.: (+47) 40 90 23 48