Content
Published:
This is an archived release.
Electricity consumption at all-time high
Despite high temperatures and high electricity prises the electricity consumption excluding power-intensive manufacturing reached record levels in July. This should be seen in conjunction with the high economic activity. The consumption in power-intensive manufacturing came to 2 872 GWh, the third highest figure ever recorded in July.
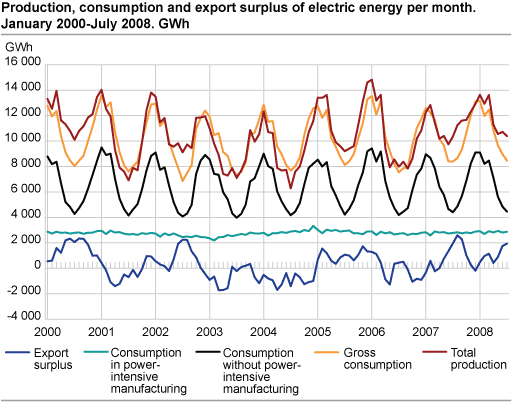
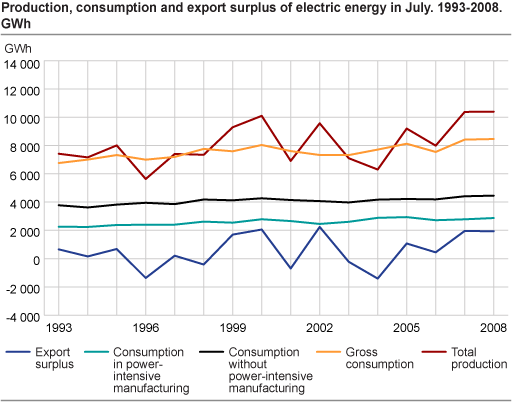
The consumption of electricity excluding power-intensive manufacturing amounted to 4 455 GWh in July, an increase of 1.0 per cent compared with the corresponding month in 2007. Households, services and other manufacturing than the power-intensive account for the majority of the consumption.
Seasonally adjusted consumption figures
As of this release seasonally adjusted figures for consumption excluding power-intensive manufacturing are included. The consumption of electricity has a clear seasonal pattern with high values during winter, lower values during summer and rising values in autumn.
The electricity consumption fell by 8.2 per cent from June to July. Nevertheless the seasonally adjusted figures for consumption excluding power-intensive manufacturing were more or less unchanged. This means that the entire decrease in the consumption figures must be seen in conjunction with systematic seasonal variation. An obvious reason for the seasonal pattern in July is the summer holiday.
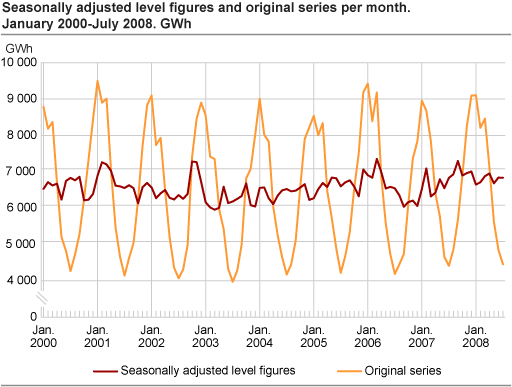

The chart below shows monthly seasonally adjusted figures and original series for consumption of electricity excluding power-intensive manufacturing in the period 2000-2008. Despite the seasonal correction there is still some non-explained variation.
Seasonally adjusted figures do not contain systematic seasonal variation. The trend of the seasonally adjusted figures shows the underlying growth in consumption. The trend indicates that the electricity consumption levelled out at approximately 6600 GWh in the period 2000(1)-2008(7).
Production at all-time high
The production of electricity amounted to 10 396 GWh. This is the highest figure ever recorded for July and 0.2 per cent higher than the same month in 2007. The high production must be seen in conjunction with large inflow to the reservoirs and good reservoirs filling. The filling was above the median throughout the entire month and was 84.8 percent at the end of week 30. The median filling for the corresponding period in the past 17 years is 82.2 per cent.
High net exports of power
Norway’s imports of power amounted to 109 GWh in July 2008, while exports totalled 2 045 GWh, resulting in a net export of 1 936 GWh.
Seasonal variationThe consumption of electricity excluding power-intensive manufacturing is strongly affected by seasonal variation during the year. The most important source of seasonal variation is temperature. However, seasonal variation in production and consumption may also contribute. We eliminate seasonal variation in electricity consumption using statistical methods, among others moving averages to "smooth" the original series. Seasonally adjusted figures indicate whether an increase (a decrease) in the original electricity data excluding power-intensive manufacturing is due to seasonal variation or an underlying increase (decrease) in the electricity consumption. |
See also
Tables:
Contact
-
Magne Holstad
E-mail: magne.holstad@ssb.no
tel.: (+47) 40 90 23 42
-
Ingvild Røstøen Ruen
E-mail: ingvild.ruen@ssb.no
tel.: (+47) 40 81 13 97
-
Tom Jonas Billit
E-mail: tom.billit@ssb.no
tel.: (+47) 40 81 13 45
-
Thomas Aanensen
E-mail: thomas.aanensen@ssb.no
tel.: (+47) 40 90 23 48