Content
Published:
This is an archived release.
Continued all time high production
The production of power came to 11 246 GWh in August, the highest production figure ever recorded for this month. Gross consumption of electricity and net exports totalled 8 653 GWh and 2 593 GWh, respectively, which is all time high as well.
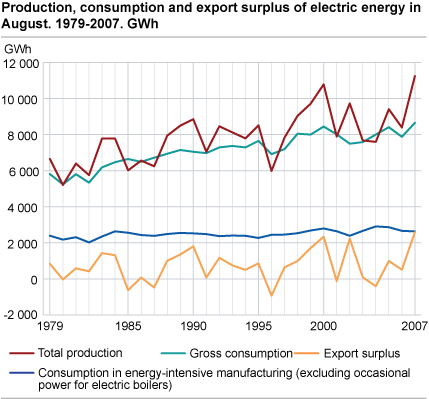
The production of power in August was 34.0 per cent higher than in the corresponding month last year, and 19.4 per cent more than in August 2005. The high production must be seen in conjunction with a very high filling, and thus a risk of overflow in many reservoirs. By risk of overflow it will be more profitable to produce power and sell it at a low price instead of loosing valuable water.
Further increase in the filling
The reservoir filling was 90.9 per cent at the beginning of August. Throughout the month, the filling increased by 2.9 percentage points to 93.8 per cent at the end of week 34. The median filling for the corresponding period in the last 15 years is 84.4 per cent.
All time high electricity consumption
The consumption in energy-intensive manufacturing came to 2 633 GWh in August, 1.2 per cent less than in the corresponding month last year. Nevertheless, the consumption in the category “Gross domestic consumption subtracted consumption in energy-intensive manufacturing” was 15.4 per cent higher in August compared with the same month last year, and the highest level recorded for this month. Households, services and other manufacturing than the energy-intensive account for the majority of this consumption. The all time high electricity consumption must be seen in conjunction with high economic activity and low electricity prices. The average elspot prices for Southern Norway, Middle Norway and Northern Norway in August were 4.3 øre/KWh, 19.7 øre/KWh and 19.5 øre/KWh, respectively. It has never been a lower elspot price in August for Southern Norway.
All time high exports of power
Norway’s imports of power came to 14 GWh in August, while exports totalled 2 607 GWh. This gave a net export of 2 593 GWh. The level of the export and net export is the highest figures ever recorded for this month. The flow of power between the countries in the Nordic Market is determined by the elspot prices. Norway will export power when the area prices are higher in Sweden, Denmark and Finland, while we will import power in the opposite case.
See also
Tables:
Contact
-
Magne Holstad
E-mail: magne.holstad@ssb.no
tel.: (+47) 40 90 23 42
-
Ingvild Røstøen Ruen
E-mail: ingvild.ruen@ssb.no
tel.: (+47) 40 81 13 97
-
Tom Jonas Billit
E-mail: tom.billit@ssb.no
tel.: (+47) 40 81 13 45
-
Thomas Aanensen
E-mail: thomas.aanensen@ssb.no
tel.: (+47) 40 90 23 48