Content
Published:
This is an archived release.
Large decrease in power production
Low production, high imports and low consumption were reported for the month of January. The production and consumption decreased by 18.7 per cent and 8.2 per cent compared with January 2002.
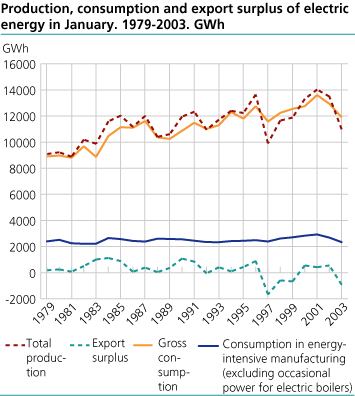
The production was in January 10 993 GWh, which is 1881 GWh less than average for the last 5 years in January. In January exports were 499 GWh and imports were 1413 GWh. This is the second highest figure for imports the last 10 years. Imports were 1781 in January 1997. The energy went from North Norway to Sweden and from South Sweden to Eastern Norway. The water reservoirs levels went down, but not much less than normal even though the production was low and imports were high. At the beginning of January the reservoirs levels were 49.6 per cent and at the end of the month 40.7 per cent of the capacity. This is record low. Medians for the beginning and the end of January are 73.6 and 62.8 per cent respectively. This shows that the trickle was low in January. The trickle was 3180 GWh in the first 5 weeks of the year according to Statnett. Average trickle for the last 13 years has been 4253 GWh according to the NVE.
Low consumption in common supply and power-intensive manufacturing
The total consumption was in January 11 907 GWh. The average consumption for the last 5 years has been 12 820 GWh. Common consumption went down 6.9 per cent compared with January last year. There was in January extensive attention around the situation in the electricity marked with high prices and low reservoirs levels. High prices and request from the authorities not to waste power my have help to reduce the consumption. Relative large parts of common consumption are used to heating and are therefore dependent on the temperature. In January the mean temperature was below normal in most of South-Norway. A large part of the population lives in South-Norway. This may have reduced the demand. As well as in December much light heating oil was sold in January. The sale was 144 million liters, which is equivalent to 1.4 TWh. Average sale for the last 5 years is equivalent to 0.7 TWh.
The consumption in power-intensive manufacturing decreased by 13 per cent compared with January last year. This is a result of reduced activity in the sector and some return sale of power, which is bought cheap on long-term contracts.
Large price changes in the spot marked
The average price in the spot market in January was NOK 0.523/KWh against NOK 0.195/KWh in January 2002. The spot price has varied much in this month. The highest price was on the 6t h with NOK 0.831/KWh and lowest was on the 26t h with NOK 0.29/KWh. Today the price is well bellow NOK 40/KWh.
See also
Tables:
Contact
-
Magne Holstad
E-mail: magne.holstad@ssb.no
tel.: (+47) 40 90 23 42
-
Ingvild Røstøen Ruen
E-mail: ingvild.ruen@ssb.no
tel.: (+47) 40 81 13 97
-
Tom Jonas Billit
E-mail: tom.billit@ssb.no
tel.: (+47) 40 81 13 45
-
Thomas Aanensen
E-mail: thomas.aanensen@ssb.no
tel.: (+47) 40 90 23 48