Content
Published:
This is an archived release.
Huge differences in density of dwellings
Almost 99 per cent of all flats are located in urban settlements, and about 60 per cent of all flats are located in Oslo, Bergen and Trondheim municipality. More than one third of all dwellings in detached houses are found in urban areas.
There were a total of 2 343 010 dwellings in Norway as at 1 January 2011, with more than half (1 223 485) being in detached houses. Flats in multi-dwelling buildings followed with 529 453, while there where 271 304 dwellings in row houses, linked houses and houses with three or four dwellings. There were 213 937 dwellings in houses with two dwellings and 43 136 dwellings in residences for communities. The remaining 61 695 dwellings are registered in buildings where the main part of the floor space is used for purposes other than dwellings, mainly industrial buildings.
Dwellings concentrated in small areas
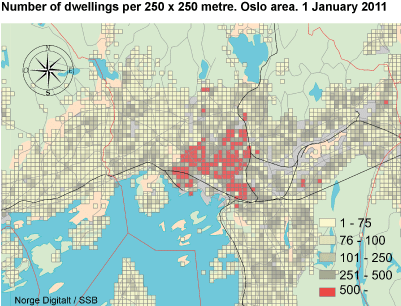
Counting the number of dwellings in a fixed geographical grid shows that the dwellings are concentrated in small areas within the urban settlements. The highest concentration of dwellings is found in areas with a high frequency of multi-dwelling buildings.
Urban settlements constitute less than 1 per cent of Mainland Norway’s land area, but include almost 80 per cent of all dwellings. Ninety-nine per cent of all flats are found in urban settlements.
Better quality of statistics
The quality of the dwelling statistics is gradually improving each year. Most of the dwellings in buildings with little information are gradually being replaced with new buildings, or new information is available when dwellings are for sale.
In terms of number of rooms, baths, toilets, access to kitchen facilities, the figures for unknown are about 11 per cent. For utility floor space of dwellings and construction year, the figure for unknown is about 5 and 8 per cent respectively.
In terms of number of dwellings with access to kitchen facilities, position of dwelling in building, geographic location, and number of floors in building, the figures for unknown are less than 1 per cent.
More figures are available at StatBank .
More figures on grids are available at EFGS .
Comparability with the Housing Census in 2001The register-based dwelling statistics cannot be compared directly with the Housing Census in 2001 . The Housing Census covered 1.96 million occupied dwellings, while the statistics on the dwelling stock include all dwellings, both occupied and vacant. Improvement of the GAB register/MatrikkelenThe municipalities are cleaning up their registers to improve the quality. This is being done continually and also especially in connection with the transition to the new official building register, “Matrikkelen”. Dwellings that were incorrectly classified the previous year may have been assigned the correct information the following year. The number of registered dwellings in the municipalities may also change from year to year because of the clean up. As a result, the number of dwellings in some of the municipalities may not be directly comparable with the previous year. Extension of the statisticsThe plan is then to extend the statistics with more information about the dwellings. In the future it is also the plan to distinguish between occupied and vacant dwellings.
More about comparability, quality and other information can be found in “About the statistics” . |
Contact
-
Jens Mathiesen
E-mail: jens.mathiesen@ssb.no
tel.: (+47) 40 81 13 98
-
Mona Takle
E-mail: mona.takle@ssb.no
tel.: (+47) 40 81 14 12

