Content
Published:
This is an archived release.
Continued population growth
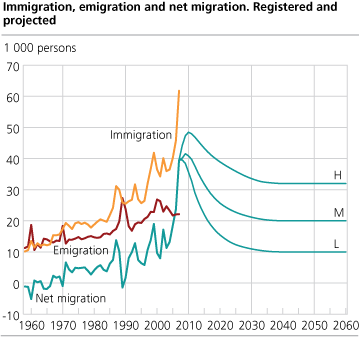
The population is projected to rise considerably in the years to 2060. The most important reason for this increase is continued immigration. The immigration surplus is expected to increase further in the next few years, followed by a decrease. However, the uncertainty in these projections is considerable.

See also Projection of the immigrant population, 2008-2060.
The development in recent years implies that we assume slightly higher fertility and life expectancy than in the last population projection, which was published in December 2005.
Population to rise to five million by 2012
The projections show that the population is likely to continue to increase in the next 52 years - from 4.7 million in 2008 to around 6.9 million in 2060. Uncertainty in these projections, particularly with regard to the size of the immigration, means that the population will be around 5.3 million and 8.5 million in 2060. We expect the population to reach five million in 2012.
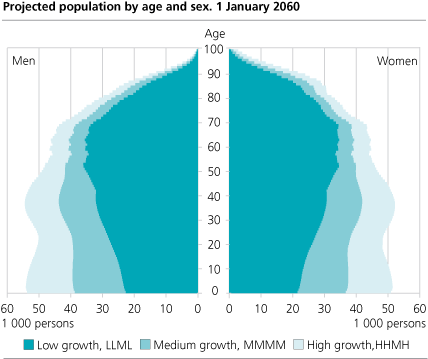
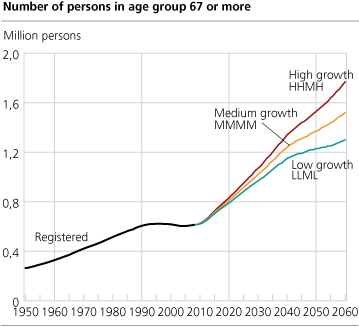
Population aged 67 and more to double in the years towards 2060
In the long run, the population will become older (see population pyramid). The number of people aged 67 and over fell from a peak of 620 000 in 1995 to slightly more than 600 000 in 2004 because the new pensioners were born in the 1930s, when the number of births was low. The number of people aged 67 and over will increase fast, from 614 000 in 2008 to around 1.6 million in 2060 - or twice today’s level.
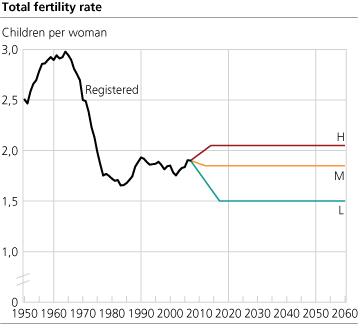
Somewhat higher fertility rate
In these projections, we have used a somewhat higher fertility level in the medium alternative than in the previous projections. We assume a total fertility rate of 1.85 children per woman because the total fertility rate has been 1.8 - 1.9 in the past 20 years except two. 1.85 children per woman is high in a European context, but is still within the reproduction level of 2.06 - 2.07 which is necessary to avoid population decline in the long run.
Due to uncertainty in several areas, including age at first birth, we have increased the total fertility rate to 2.05 from 2014 in the high alternative. This is only slightly lower than the reproduction level. There is also a possibility that economic recessions and other factors may result in a fertility level in line with that of Western Europe, i.e. around 1.5 children per woman. In the low alternative we expect this to happen in the next decade, i.e. in 2017.
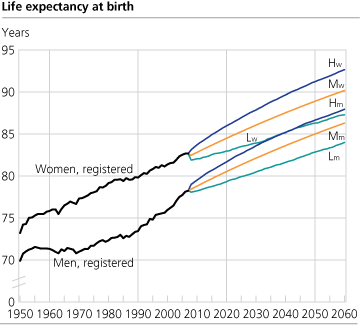
Increase in life expectancy
Life expectancy is expected to increase from 78.2 years for men and 82.7 years for women in 2007 to between 84.0 and 87.9 years for men and between 87.7 and 92.7 for women in 2060. These assumptions build on an analysis of the development in the period 1900 - 2007. The strong growth in life expectancy in 2002-2006 has resulted in somewhat higher figures than in the 2005 projections, but the growth rate is more or less the same.
About the statistical basisThe population statistics include persons who are registered as resident in the population register, i.e. persons who live in Norway permanently or intend to live here for at least six months and have a valid residence permit (not required for Nordic citizens). |
| Registered | Alternatives | ||||||||||||||||||||||||||||||||||||||
|---|---|---|---|---|---|---|---|---|---|---|---|---|---|---|---|---|---|---|---|---|---|---|---|---|---|---|---|---|---|---|---|---|---|---|---|---|---|---|---|
| L | M | H | K | 0 | |||||||||||||||||||||||||||||||||||
| Total Fertility Rate | |||||||||||||||||||||||||||||||||||||||
| 2007 | 1.90 | ||||||||||||||||||||||||||||||||||||||
| 2017-2060 | 1.5 | 1.85 | 2.05 | ||||||||||||||||||||||||||||||||||||
| Life Expectancy at birth: Men | |||||||||||||||||||||||||||||||||||||||
| 2007 | 78.24 | ||||||||||||||||||||||||||||||||||||||
| 2060 | 84 | 86.3 | 87.9 | 78.2 | |||||||||||||||||||||||||||||||||||
| Life Expectancy at birth: Women | |||||||||||||||||||||||||||||||||||||||
| 2007 | 82.66 | ||||||||||||||||||||||||||||||||||||||
| 2060 | 87.3 | 90.2 | 92.7 | 82.7 | |||||||||||||||||||||||||||||||||||
| Net immigration per year | |||||||||||||||||||||||||||||||||||||||
| 2007 | 39 500 | ||||||||||||||||||||||||||||||||||||||
| 2008 | 39 600 | 40 000 | 44 200 | ||||||||||||||||||||||||||||||||||||
| 2009 | 38 400 | 41 500 | 47 300 | 0 | |||||||||||||||||||||||||||||||||||
| 2040-2060 | 10 000 | 20 000 | 32 300 | 0 | |||||||||||||||||||||||||||||||||||
| Domestic mobility | |||||||||||||||||||||||||||||||||||||||
| 2008-2060 | Moving pattern as in 2003-2007 | ||||||||||||||||||||||||||||||||||||||
The next population projections will be published in spring 2009.
Tables:
- Table 1 Population 1 January. Registered 2008. Projected 2009-2060 in fourteen variants. 1 000
- Table 2 The number of births and deaths. Absolute and relatve population growth. Registered 2007. Projected 2008-2060 by three variants
- Table 3 Population by age per 1 January. Registered 2008. Projected 2009-2060
- Table 4 Annual growth of total population 2008-2013, by six variants. Centrality and county. Per cent
- Table 5 Population per 1 January, by county and municipality. Registered 2008. Projected 2009-2030, by variant LLML
- Table 6 Population per 1 January, by county and municipality. Registered 2008. Projected 2009-2030, by variant MMMM
- Table 7 Population per 1 January, by county and municipality. Registered 2008. Projected 2009-2030, by variant HHMH
- Table 8 Population per 1 January, by county and municipality. Registered 2008. Projected 2009-2030, by variant MMML
- Table 9 Population per 1 January, by county and municipality. Registered 2008. Projected 2009-2030, by variant MMMH
Contact
-
Statistics Norway's Information Centre
E-mail: informasjon@ssb.no
tel.: (+47) 21 09 46 42
-
Inquiries about national projections
E-mail: nasjfram@ssb.no
-
Inquiries about regional projections
E-mail: regfram@ssb.no
-
Michael Thomas
E-mail: michael.thomas@ssb.no
tel.: (+47) 40 90 26 28
-
Ane Margrete Tømmerås
E-mail: ane.tommeras@ssb.no
tel.: (+47) 91 99 29 62