Content
Published:
This is an archived release.
Increasing population growth for a few more years
The population growth is probably going to increase for a few more years before it will decline. The 5 million mark will be passed in 2012 and 6 million in 2028 according to the main variant of the new projections. Uncertainty about the immigration is considerable, however.
The new population projections give figures by age and sex for all municipalities and counties. In addition, but at national level only, projections are made for immigrants and Norwegian-born children with immigrant parents by country background for three groups of countries.
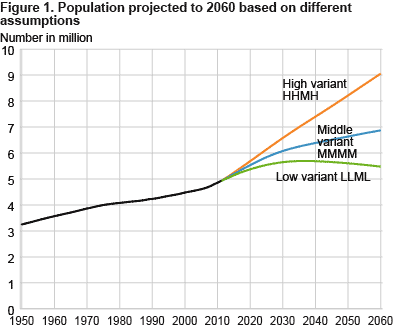
The projections show that the population will increase significantly over the next 50 years, from 4.9 million in 2011 to 6.9 million in 2060 in the main variant (MMMM, see the text box). The 6 million mark may be passed as early as in 2023, or not at all in this century, as shown in Figure 1.
The assumptions affect the projection results
There is considerable uncertainty about the extent to which the assumptions will be close to the actual future developments, especially for immigration. To illustrate how sensitive the calculations are, we have also made projections based on alternative assumptions. In the scenario with the highest population growth (HHMH, i.e. high fertility, high life expectancy, average domestic mobility and high immigration, see the text box) the population reaches 9.1 million in 2060. In the scenario with the lowest population growth (LLML), the population peaks at 5.9 million in 2037 and then declines to 5.5 million in 2060. It is particularly the assumptions about immigration that lead to the large differences in the projected population size.
High population growth during the first years
The population growth is particularly high in the first projection years. According to the main alternative, the growth increases from 62 000 in 2010 to 70 000 in 2014 and decreases thereafter, to 21 000 in 2060. This is primarily because it is assumed that migration will increase in the coming years, especially immigration from the European Economic Area (EEA), and then go down.
Later in the projection period the population growth slows down because the role of immigration in the projections has changed. Our new model takes into account that immigrants have a higher probability of emigration than the rest of the population and this causes a significant increase in emigration over time, and consequently a decrease in net immigration.
For the first part of the period, the new population figures are significantly higher than those presented in June 2010. The difference increases to more than 300 000 around 2025, but decreases thereafter and becomes negative at the end of the period, according to the main variant.
Every fourth person is an immigrant or Norwegian-born to immigrant parents in 2060
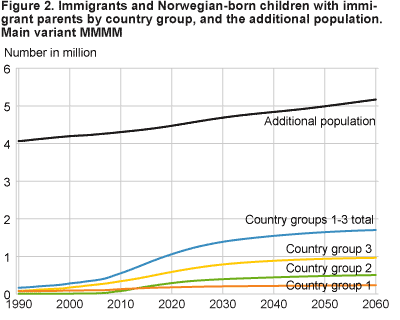
In the main variant, the number of immigrants and Norwegian-born to immigrant parents grows from 0.6 million in 2011 to 1.7 million in 2060. In the variant where immigration is high, but all other assumptions are medium (MMMH), this group reaches 3.1 million in 2060. The rest of the population will increase from 4.3 million today to 5.2 million in 2060 in MMMM, and to 5.4 million in MMMH, see Figure 2. By 2060, there will, according to the main variant, be 0.2 million immigrants and Norwegian-born to immigrant parents from country group 1 (Western European countries and the United States, Canada, Australia and New Zealand), 0.5 million from country group 2 (Eastern European EU countries), and 1 million from country group 3 (rest of the world). Thus, these three groups will constitute 3 per cent, 7 per cent and 14 per cent respectively of the total population in 2060. Immigrants and Norwegian-born with immigrant parents, who today constitute 12 per cent of the population, will grow to 25 per cent in 2060 in the main variant. According to the variant with the highest immigration, this share will grow to 36 per cent in 2060 and further to 37 per cent in 2070, and then decline.
More from all country groups
The number of immigrants will increase for all three country groups toward the end of the projection period 2011-2060; 200 000, 400 000 and 640 000 respectively, and then decline somewhat. The number of Norwegian-born to immigrant parents, however, will increase throughout the period, to 30 000, 110 000 and 330 000 respectively, and increase more and more relative to their parents. Today, immigrants constitute 10 per cent and their Norwegian-born children 2 per cent of the total population. By 2060, these percentages will be 18 and 7 per cent, according to the main variant. More detailed figures can be found in Table 2 below and in Statbank.
Regional population development to 2040
During the next 15 years, the population will grow in all 19 counties, according to the main alternative (MMMM). Until 2030, the growth is expected to be strongest in Rogaland, Oslo and Akershus. In the main variant, Oslo is growing from 599 000 in 2011 to 786 000 in 2030, which is 21 000 higher than in the 2010 projection. The main reason for this is the immigration assumption for the coming years. The projection model assumes a constant proportion of all immigration for each region, and does not take into account any capacity problems associated with housing, etc.
Until the mid 2000s, about half of the municipalities had a declining population, but with the immigration surplus of recent years, the number of municipalities with a population decline is going down. According to the main variant, the population in 2015 is estimated to increase in 297 of the country's 430 municipalities.
Assumptions
The assumptions will be discussed in more detail in økonomiske analyser 4/2011 (in Norwegian only). Only the main points are mentioned here.
Fertility
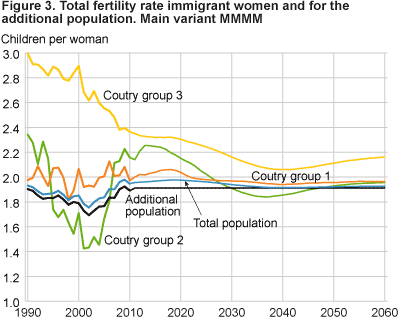
For women who are not immigrants, the total fertility rate (TFR, see text box) in the middle alternative is kept constant at 1.91 children per woman throughout the projection period. In the high alternative, TFR is estimated to increase to 2.15 in 2005 and then held constant, while it is reduced to 1.71 in 2020 and kept constant thereafter in the low alternative. These assumptions are similar to the 2010 projection assumptions. Separate assumptions are made for the fertility trends of immigrant women from each of the three country groups. For these, it is assumed that fertility will approach the level of women who are not immigrants. The fertility level for each of the immigrant groups will also depend on the duration of residence, as birth rates are highest during the first years in Norway. The TFR of the total population is also affected by the distribution of the different categories. Figure 3 shows the TFR for each group according to the medium alternative. Figures for the other alternatives are shown in Table 5 below.
Mortality
Life expectancy at birth is estimated to rise to 86 years for men and 89 years for women; about one year less than in the 2010 projections. The same mortality rate is assumed for all groups, i.e. immigrants, their children born in Norway, and the rest of population. In the low alternative, it is assumed that life expectancy in 2060 increases to 81.9 years for men and 84.4 years for women, and in the high alternative to 88.9 years for men and 92.2 years for women. 3
The future mortality rates are estimated on the basis of an analysis of data for the period 1950-2010. This has led to a smaller reduction in mortality for children and young people and a larger decline for the older age groups compared to the 2010 projections.
Immigration
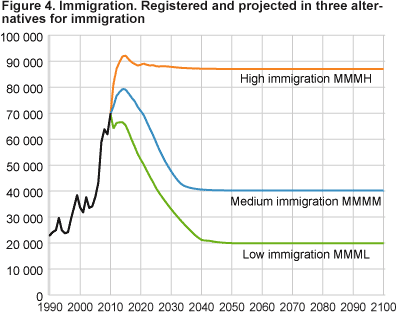
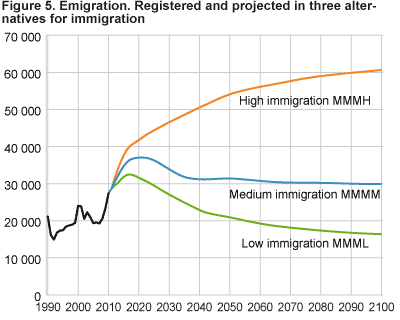
We assume that the overall migration will increase until 2014 both in the middle and high alternatives, and then decline significantly. In the low alternative, we assume that immigration will begin to decline immediately, see Figure 5, the overview table, and table 4 below.
The assumption about increasing immigration in the coming years (alt. M and H) is strengthened by the fact that immigration has continued to increase in 2011. Immigration in the 12-month period ending on 31 March was 77 000, which is the highest figure ever.
The future immigration is estimated using an economic model where immigration is determined by immigration in previous years, the income level in Norway compared to OECD countries, and changes in the unemployment rate in Norway. 1 Estimates of future unemployment are taken from Statistics Norway's latest economic report (økonomiske analyser 3/2011) . The relative income is expected to decline from 170 in 2010 to 140 in 2040 and thereafter. 2 The estimates are made separately for the three country groups included in the projections.
The uncertainty is taken into account by assuming some fairly extreme scenarios for the evolution of the relative income level in Norway soon: in the high alternative, we keep it constant at the 2010 level, while in the low alternative we let it drop to 112 in 2040. The migration estimates derived from these income profiles are in addition adjusted with the parameter uncertainty in the model, in that we added one standard error in the highest alternative and subtracted one standard error for each year and country group in the lowest alternative. The results of this are shown in Figure 4 and Table 4.
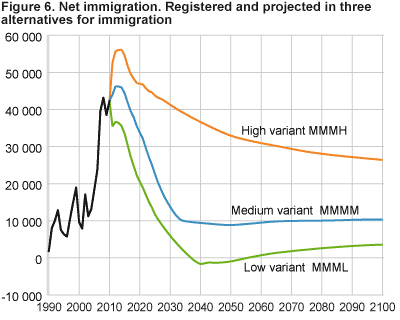
Emigration is calculated by the model using constant emigration probabilities, which vary by age, sex, duration of residence in Norway and country group. These probabilities are significantly higher for immigrants than for their children born in Norway, which have a higher emigration propensity than the general population. For the three country groups, the greatest propensity of emigration is for people with a background from group 1 and the least is for those from group 3. Emigration is greatest during the first years after immigrating to Norway and decreases thereafter. Increasing numbers of immigrants in the country lead to increasing emigration, particularly of immigrants with a short duration of residence. This reduces the net immigration, which, after some years will decrease substantially, as shown in Figure 6. In 2040 it drops to 10 000 in the main variant, whereas in the 2010 projection it was assumed to be 22 000 per year from 2016 in the main variant.
Definitions and explanationsPopulation projection : An estimate of the future size and composition of a population, usually by sex, age and residence (municipality). This is done by the application of probabilities or rates for deaths, in- and out-migration and fertility (for women aged 15-49). For immigrants and their children born in Norway we use emigration probabilities and birth rates by sex, age and country group, see below, and also by duration of stay in Norway for immigrants.
Models : Two models have been used to project the population: * The first model, BEFINN, projects the population of immigrants and their children born in Norway as well as the additional population, by sex and age, for the whole country. Immigrants and their children born in Norway are also projected by country background, and immigrants by duration of stay in Norway. * The second model, BEFFREG, projects the population by sex and age for all 430 municipalities, as for previously. The results from this are adjusted to assure consistency at national level with the BEFINN projections.
Alternatives : Alternative assumptions have been made for each of the four components in the projections: fertility , life expectancy , inter - municipality migration and immigration . The assumptions are designated as L (low), M (medium), H (high), K (constant life expectancy) or 0 (for migration in Norway and for immigration and emigration). The main variant MMMM assumes the medium level for each component. For the first time, alternative assumptions have been made about immigration and not about net immigration. Emigration and net immigration follow from the assumptions that have been made and are computed by the model.
Country group : (1) Countries in the EU/EEA/EFTA in Western Europe and USA, Canada, Australia and New Zealand. (2) EU countries in Eastern Europe. (3) Rest of the world, i.e. rest of Europe, Asia, Africa, Latin America and Oceania except Australia and New Zealand. A more precise list of the countries included in the three groups is available . Immigrant : Person born abroad with two foreign-born parents and who has immigrated to Norway. Net migration is the difference between migrations to and from the country during a period.
Life expectancy is the expected number of years a person can expect to live according to the death rates in a given period, usually a calendar year. It is usually estimated at birth but can also be estimated for other ages. Total fertility rate ( TFR ) is the sum of age-specific fertility rates for women 15-49 years of age in a calendar year. It can be interpreted as the average of children per woman on the assumption that the fertility pattern is continuing and that there are no deaths before age 50. The TFR has to be greater than 2.06-2.07 children (the reproduction level) in order to prevent a population decline in the long run, excluding immigration and emigration. |
| Registered | Alternatives | ||||||||||||||||||||||||||||||||||||||||||||||||||||||||||||||||||||||||||||||
|---|---|---|---|---|---|---|---|---|---|---|---|---|---|---|---|---|---|---|---|---|---|---|---|---|---|---|---|---|---|---|---|---|---|---|---|---|---|---|---|---|---|---|---|---|---|---|---|---|---|---|---|---|---|---|---|---|---|---|---|---|---|---|---|---|---|---|---|---|---|---|---|---|---|---|---|---|---|---|---|
| L | M | H | K | 0 | |||||||||||||||||||||||||||||||||||||||||||||||||||||||||||||||||||||||||||
| Fertility. Total fertility rate (children per woman) | |||||||||||||||||||||||||||||||||||||||||||||||||||||||||||||||||||||||||||||||
| 2010 | 1,95 | ||||||||||||||||||||||||||||||||||||||||||||||||||||||||||||||||||||||||||||||
| 2015 | 1,85 | 1,97 | 2,12 | ||||||||||||||||||||||||||||||||||||||||||||||||||||||||||||||||||||||||||||
| 2060 | 1,71 | 1,93 | 2,08 | ||||||||||||||||||||||||||||||||||||||||||||||||||||||||||||||||||||||||||||
| Life expectancy at birth (years): Men | |||||||||||||||||||||||||||||||||||||||||||||||||||||||||||||||||||||||||||||||
| 2010 | 78,9 | ||||||||||||||||||||||||||||||||||||||||||||||||||||||||||||||||||||||||||||||
| 2060 ii | 81,9 | 86,0 | 88,9 | 78,9 | |||||||||||||||||||||||||||||||||||||||||||||||||||||||||||||||||||||||||||
| Life expectancy at birth (years): Women | |||||||||||||||||||||||||||||||||||||||||||||||||||||||||||||||||||||||||||||||
| 2010 | 83,2 | ||||||||||||||||||||||||||||||||||||||||||||||||||||||||||||||||||||||||||||||
| 2060 ii | 84,4 | 89,1 | 92,2 | 83,2 | |||||||||||||||||||||||||||||||||||||||||||||||||||||||||||||||||||||||||||
| Immigration per year | |||||||||||||||||||||||||||||||||||||||||||||||||||||||||||||||||||||||||||||||
| 2010 | 73 852 | ||||||||||||||||||||||||||||||||||||||||||||||||||||||||||||||||||||||||||||||
| 2011 | 64 071 | 72 689 | 81 307 | ||||||||||||||||||||||||||||||||||||||||||||||||||||||||||||||||||||||||||||
| 2060 | 19 961 | 40 251 | 87 048 | 0 | |||||||||||||||||||||||||||||||||||||||||||||||||||||||||||||||||||||||||||
| Net immigration per year | |||||||||||||||||||||||||||||||||||||||||||||||||||||||||||||||||||||||||||||||
| 2010 | 42 346 | ||||||||||||||||||||||||||||||||||||||||||||||||||||||||||||||||||||||||||||||
| 2015 | 32 077 | 42 837 | 52 907 | ||||||||||||||||||||||||||||||||||||||||||||||||||||||||||||||||||||||||||||
| 2060 | 1 387 | 8 495 | 26 940 | ||||||||||||||||||||||||||||||||||||||||||||||||||||||||||||||||||||||||||||
| Inter-municipal migrations | |||||||||||||||||||||||||||||||||||||||||||||||||||||||||||||||||||||||||||||||
| 2011-2040 | Migration pattern as in 2006-2010 i . | 0 | |||||||||||||||||||||||||||||||||||||||||||||||||||||||||||||||||||||||||||||
| i | A small decline in mobility has been assumed for 2011-2015. |
| ii | Figures were corrected for columns L, M and H 17 June 2011 at 16.50 pm. |
More detailed results can be found in Statistics Norway’s Statbank . Results until 2100 are included because some analyses, especially of pensions, require very long-term periods.
Background material will be presented in Norwegian in økonomiske analyser no. 4, 2011 , to be published on 8 September 2011. The next projections are planned to be published in June 2012.
1 An earlier version of this model has been published in "Forecasting migration flows to and from Norway using an econometric model", by H. Brunborg and å. Cappelen. Eurostat methodological Working papers 2010 .
2 å. Cappelen, T. Eika and J. Prestmo: "Redusert petroleumsaktivitet: En utfordring for norsk økonomi?" økonomiske analyser 2/2011 .
3 Figures in sentence were corrected 17 June 2011 at 15.35 pm.
Tables:
- Table 1 Population 1 January. Registered 2011. Projected 2012-2100 in fourteen variants. In 1 000
- Table 2 Total population, immigrants and Norwegian-born to immigrant parents, by country background. Registered 2011. Projected 2011-2100 in three variants. In 1 000
- Table 3 Number of births and deaths. Absolute and relative population growth. Registered 2010. Projected 2011-2100 in three variants. In 1 000
- Table 4 Immigration, emigration and net migration, total and for immigrants, by country background. Registered 2010. Projected 2011-2100 in three variants
- Table 5 Total fertility rate for all women and for immigrant women from three groups of countries. Registered 2010. Projected 2011-2100, in three variants
- Table 6 Life expectancy for males and females. Registered 2010. Projected 2011-2100 in three variants
Contact
-
Statistics Norway's Information Centre
E-mail: informasjon@ssb.no
tel.: (+47) 21 09 46 42
-
Inquiries about national projections
E-mail: nasjfram@ssb.no
-
Inquiries about regional projections
E-mail: regfram@ssb.no
-
Michael Thomas
E-mail: michael.thomas@ssb.no
tel.: (+47) 40 90 26 28
-
Ane Margrete Tømmerås
E-mail: ane.tommeras@ssb.no
tel.: (+47) 91 99 29 62