Content
Published:
This is an archived release.
High immigration and population growth in 3rd quarter
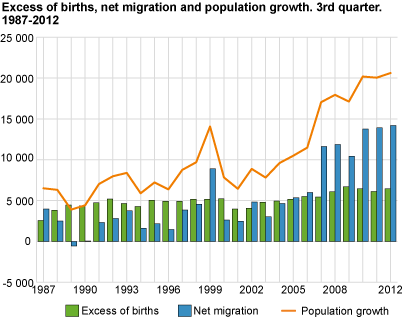
The population increased by 20 600 persons to 5 038 100 in the 3rd quarter of 2012. Population growth was 6 000 higher than in the previous quarter. A total of 24 200 people immigrated, while 10 000 emigrated. The net migration of 14 200 is the highest observed in any quarter.
Immigration continues at the same high level as in the last two years. Compared to the same quarter in previous years, the population growth has never been higher and is at a level of two to three times as high as up to and including 2006. A total of 16 200 children were born and 9 800 persons died in the 3rd quarter. The birth surplus of 6 400 has been at the same level since 2008.
As usual in recent years, population growth was highest in Oslo/Akershus and in Rogaland/Hordaland. Oppland had the lowest growth both in numbers and in relative terms.
The population increased by 52 300 during the first three quarters of 2012, approximately the same as in the first three quarters last year.
Oslo had the highest birth surplus
In the 3rd quarter, Oslo again had the highest birth surplus, also in relation to the population. A total of 2 700 children were born and 1 050 persons died.
Hedmark and Oppland had the lowest birth surplus, where only 15 more persons were born than died.
High immigration by Poles, Lithuanians and Swedes
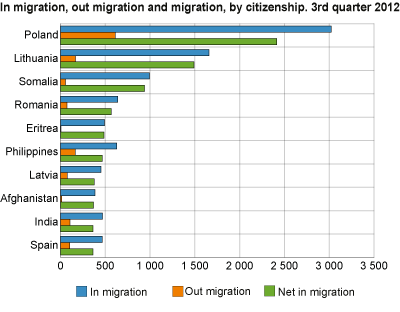
Many Poles, Lithuanians and Swedes immigrated in the 3rd quarter, but nearly twice as many Romanian citizens immigrated in the 3rd quarter as in the 2nd quarter.
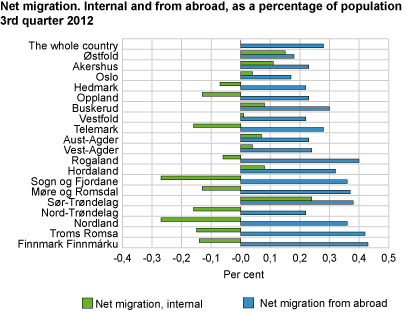
Swedish citizens were clearly the largest group emigrating from Norway, with a net immigration of only 150. Net immigration of Polish and Lithuanian citizens was 3 900 altogether, which is more than a quarter of the total net immigration. Net migration of 360 Spanish citizens made them the 10th largest group. The highest net immigration was found in Hordaland, followed by Akershus and Sør-Trøndelag.
Domestic migration
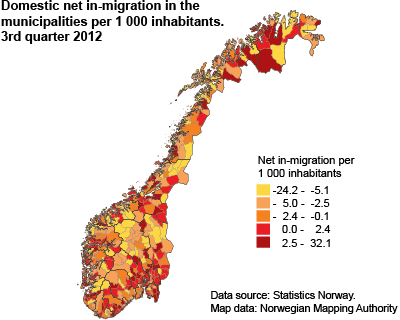
Nine counties had a domestic net in-migration, whereas 10 had a domestic net out-migration. Sør-Trøndelag had the highest net in-migration with 700, while Akershus was second. Particularly in the inner parts of the country, in the North-western and Northern parties of Norway do we find net out-migration, but also in Rogaland. The highest activity in migration in and out of the county was found in Oslo, where almost five per cent of the population either migrated to or from the county during the 3rd quarter.
| Total migration gain (321 in total) | Domestic migration gain (165 in total) | Migration gain from abroad (419 in total) | |||||||||||||||||||||||||||||||||||||||||||||||||||||||||||||||||||||||||||||
|---|---|---|---|---|---|---|---|---|---|---|---|---|---|---|---|---|---|---|---|---|---|---|---|---|---|---|---|---|---|---|---|---|---|---|---|---|---|---|---|---|---|---|---|---|---|---|---|---|---|---|---|---|---|---|---|---|---|---|---|---|---|---|---|---|---|---|---|---|---|---|---|---|---|---|---|---|---|---|---|
| 1 | 0301 Oslo | 3 531 | 0106 Fredrikstad | 535 | 0301 Oslo | 4 527 | |||||||||||||||||||||||||||||||||||||||||||||||||||||||||||||||||||||||||
| 2 | 1201 Bergen | 2 268 | 0219 Bærum | 508 | 1201 Bergen | 2 317 | |||||||||||||||||||||||||||||||||||||||||||||||||||||||||||||||||||||||||
| 3 | 1601 Trondheim | 1 798 | 1102 Sandnes | 435 | 1103 Stavanger | 1 824 | |||||||||||||||||||||||||||||||||||||||||||||||||||||||||||||||||||||||||
| 4 | 0219 Bærum | 1 411 | 1601 Trondheim | 322 | 1601 Trondheim | 1 476 | |||||||||||||||||||||||||||||||||||||||||||||||||||||||||||||||||||||||||
| 5 | 1102 Sandnes | 1 131 | 1121 Time | 295 | 0219 Bærum | 903 | |||||||||||||||||||||||||||||||||||||||||||||||||||||||||||||||||||||||||
| 6 | 0106 Fredrikstad | 893 | 0217 Oppegård | 257 | 1102 Sandnes | 696 | |||||||||||||||||||||||||||||||||||||||||||||||||||||||||||||||||||||||||
| 7 | 1001 Kristiansand | 769 | 0237 Eidsvoll | 246 | 0602 Drammen | 605 | |||||||||||||||||||||||||||||||||||||||||||||||||||||||||||||||||||||||||
| 8 | 1103 Stavanger | 648 | 1001 Kristiansand | 220 | 1001 Kristiansand | 549 | |||||||||||||||||||||||||||||||||||||||||||||||||||||||||||||||||||||||||
| 9 | 0231 Skedsmo | 624 | 0233 Nittedal | 202 | 1902 Tromsø | 533 | |||||||||||||||||||||||||||||||||||||||||||||||||||||||||||||||||||||||||
| 10 | 0220 Asker | 588 | 0627 Røyken | 192 | 1504 ålesund | 532 | |||||||||||||||||||||||||||||||||||||||||||||||||||||||||||||||||||||||||
| Total migration loss (100 in total) | Domestic migration loss (257 in total) | Migration loss to abroad (7 in total) | |||||||||||||||||||||||||||||||||||||||||||||||||||||||||||||||||||||||||||||
| 10 | 0536 Søndre Land | -32 | 1703 Namsos | -96 | |||||||||||||||||||||||||||||||||||||||||||||||||||||||||||||||||||||||||||
| 9 | 0935 Iveland | -33 | 0819 Nome | -96 | |||||||||||||||||||||||||||||||||||||||||||||||||||||||||||||||||||||||||||
| 8 | 1820 Alstahaug | -33 | 1702 Steinkjer | -105 | |||||||||||||||||||||||||||||||||||||||||||||||||||||||||||||||||||||||||||
| 7 | 1511 Vanylven | -37 | 1820 Alstahaug | -105 | 1920 Lavangen | -1 | |||||||||||||||||||||||||||||||||||||||||||||||||||||||||||||||||||||||||
| 6 | 1443 Eid | -40 | 1401 Flora | -106 | 0441 Os | -1 | |||||||||||||||||||||||||||||||||||||||||||||||||||||||||||||||||||||||||
| 5 | 0520 Ringebu | -42 | 2003 Vadsø | -109 | 0632 Rollag | -1 | |||||||||||||||||||||||||||||||||||||||||||||||||||||||||||||||||||||||||
| 4 | 0419 Sør-Odal | -43 | 1504 ålesund | -160 | 0121 Rømskog | -2 | |||||||||||||||||||||||||||||||||||||||||||||||||||||||||||||||||||||||||
| 3 | 0941 Bykle | -45 | 1805 Narvik | -190 | 1717 Frosta | -3 | |||||||||||||||||||||||||||||||||||||||||||||||||||||||||||||||||||||||||
| 2 | 1424 årdal | -54 | 0301 Oslo | -996 | 0418 Nord-Odal | -5 | |||||||||||||||||||||||||||||||||||||||||||||||||||||||||||||||||||||||||
| 1 | 1837 Meløy | -77 | 1103 Stavanger | -1 176 | 1004 Flekkefjord | -6 | |||||||||||||||||||||||||||||||||||||||||||||||||||||||||||||||||||||||||
|
Excess of births
(216 in total) |
Excess of births in relation to population /
1 000 (216 in total) (Norway = 3.1) |
Population growth (301 in total) |
Population growth in relation to population /
1 000 (301 in total) (Norway = 10.5) |
||||||||||||||||||||||||||||||||||||||||||||||||||||||||||||||||||||||||||||
|---|---|---|---|---|---|---|---|---|---|---|---|---|---|---|---|---|---|---|---|---|---|---|---|---|---|---|---|---|---|---|---|---|---|---|---|---|---|---|---|---|---|---|---|---|---|---|---|---|---|---|---|---|---|---|---|---|---|---|---|---|---|---|---|---|---|---|---|---|---|---|---|---|---|---|---|---|---|---|---|
| 1 | 0301 Oslo | 4 516 | 1142 Rennesøy | 10,5 | 0301 Oslo | 8 047 | 2023 Gamvik | 49,6 | |||||||||||||||||||||||||||||||||||||||||||||||||||||||||||||||||||||||
| 2 | 1201 Bergen | 1 130 | 1034 Hægebostad | 9,6 | 1201 Bergen | 3 398 | 1252 Modalen | 45,9 | |||||||||||||||||||||||||||||||||||||||||||||||||||||||||||||||||||||||
| 3 | 1601 Trondheim | 977 | 1120 Klepp | 9,4 | 1601 Trondheim | 2 775 | 1724 Verran | 45,5 | |||||||||||||||||||||||||||||||||||||||||||||||||||||||||||||||||||||||
| 4 | 1103 Stavanger | 676 | 0935 Iveland | 9,2 | 0219 Bærum | 1 809 | 1142 Rennesøy | 44,4 | |||||||||||||||||||||||||||||||||||||||||||||||||||||||||||||||||||||||
| 5 | 1102 Sandnes | 542 | 1121 Time | 8,7 | 1102 Sandnes | 1 673 | 1256 Meland | 34,5 | |||||||||||||||||||||||||||||||||||||||||||||||||||||||||||||||||||||||
| 6 | 0219 Bærum | 398 | 1119 Hå | 8,6 | 1103 Stavanger | 1 324 | 1121 Time | 32,9 | |||||||||||||||||||||||||||||||||||||||||||||||||||||||||||||||||||||||
| 7 | 1902 Tromsø | 368 | 1124 Sola | 8,3 | 1001 Kristiansand | 1 076 | 1429 Fjaler | 30,7 | |||||||||||||||||||||||||||||||||||||||||||||||||||||||||||||||||||||||
| 8 | 1001 Kristiansand | 307 | 1102 Sandnes | 8,0 | 0106 Fredrikstad | 984 | 1129 Forsand | 30,3 | |||||||||||||||||||||||||||||||||||||||||||||||||||||||||||||||||||||||
| 9 | 1804 Bodø | 246 | 1130 Strand | 8,0 | 1902 Tromsø | 943 | 1216 Sveio | 30,0 | |||||||||||||||||||||||||||||||||||||||||||||||||||||||||||||||||||||||
| 10 | 1247 Askøy | 206 | 1247 Askøy | 7,9 | 0231 Skedsmo | 800 | 2017 Kvalsund | 28,7 | |||||||||||||||||||||||||||||||||||||||||||||||||||||||||||||||||||||||
|
Birth deficit
(200 in total) |
Birth deficit in relation to population /
1 000 (200 in total) |
Population decrease
(120 in total) |
Population decrease in relation to population /
1 000 (120 in total) |
||||||||||||||||||||||||||||||||||||||||||||||||||||||||||||||||||||||||||||
| 10 | 1867 Bø | -23 | 1867 Bø | -8,5 | 0536 Søndre Land og 1413 Hyllestad | -39 | 1571 Halsa | -16,5 | |||||||||||||||||||||||||||||||||||||||||||||||||||||||||||||||||||||||
| 9 | 0432 Rendalen | -23 | 1845 Sørfold | -8,5 | 0941 Bykle | -40 | 2022 Lebesby | -17,0 | |||||||||||||||||||||||||||||||||||||||||||||||||||||||||||||||||||||||
| 8 | 0538 Nordre Land | -26 | 1928 Torsken | -9,0 | 0432 Rendalen | -42 | 1234 Granvin | -17,3 | |||||||||||||||||||||||||||||||||||||||||||||||||||||||||||||||||||||||
| 7 | 0423 Grue | -30 | 1859 Flakstad | -10,1 | 1848 Steigen | -42 | 1265 Fedje | -17,4 | |||||||||||||||||||||||||||||||||||||||||||||||||||||||||||||||||||||||
| 6 | 0901 Risør | -30 | 1755 Leka | -10,5 | 1511 Vanylven | -43 | 0432 Rendalen | -21,4 | |||||||||||||||||||||||||||||||||||||||||||||||||||||||||||||||||||||||
| 5 | 0807 Notodden | -31 | 1917 Ibestad | -10,6 | 1424 årdal | -45 | 1943 Kvænangen | -24,9 | |||||||||||||||||||||||||||||||||||||||||||||||||||||||||||||||||||||||
| 4 | 0403 Hamar | -38 | 2017 Kvalsund | -10,9 | 0419 Sør-Odal | -46 | 1413 Hyllestad | -26,7 | |||||||||||||||||||||||||||||||||||||||||||||||||||||||||||||||||||||||
| 3 | 0815 Kragerø | -43 | 0432 Rendalen | -11,7 | 0520 Ringebu | -51 | 1151 Utsira | -36,7 | |||||||||||||||||||||||||||||||||||||||||||||||||||||||||||||||||||||||
| 2 | 0425 åsnes | -44 | 1633 Osen | -12,7 | 1837 Meløy | -74 | 0941 Bykle | -41,2 | |||||||||||||||||||||||||||||||||||||||||||||||||||||||||||||||||||||||
| 1 | 0428 Trysil | -53 | 1265 Fedje | -15,6 | 0428 Trysil | -75 | 1856 Røst | -42,0 | |||||||||||||||||||||||||||||||||||||||||||||||||||||||||||||||||||||||
The statistics is published with Population.
Contact
-
Statistics Norway's Information Centre
E-mail: informasjon@ssb.no
tel.: (+47) 21 09 46 42


