Content
Published:
This is an archived release.
Population increases by 14 700
The size of the population of Norway increased by 14 700 during the 2nd quarter of 2010, to 4 888 000 residents. The excess of births was 6 400, and the net migration from abroad was 8 800. All the 19 counties had an increase in population.
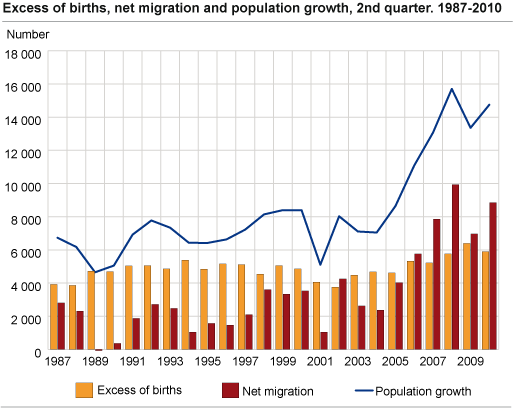
After the decrease in growth in the 2nd quarter of 2009, an increase could once again be seen in the 2nd quarter of 2010. The migration gain was at the second highest level ever in a 2nd quarter; about 1 000 below the 2nd quarter of 2008. The number of births dropped slightly and the number of deaths was at the same level as the 2nd quarter of 2009. Proportionally, the population increase was highest in Akershus (2 400) and Rogaland (1 900), and lowest in Finnmark (26).
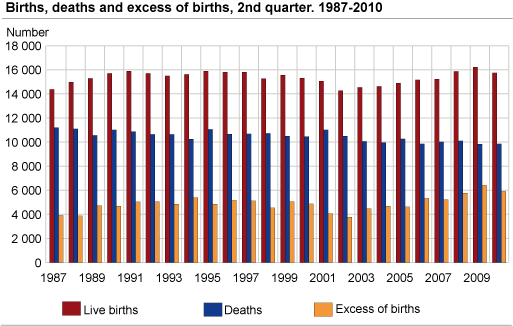
A minor drop in births
The number of births has been increasing every 2nd quarter since 2003. From 2009 to 2010, the number of births decreased from 16 200 to 15 700; a minor drop, but nevertheless a break in the trend.
Excess of births in all counties except Hedmark and Oppland
There were more births than deaths in all counties except Hedmark and Oppland during the 2nd quarter. Of the 50 quarters that have passed since 1997, Hedmark has had a birth deficit in 43 quarters and Oppland 38. Oslo had the highest excess of births, with 1 600 more births than deaths. Proportionally, the excess of births was highest in Oslo among the counties, with 2.8 per 1 000 inhabitants. Oslo and Akershus made up 41 per cent of the total excess of births for the whole country; about the same level as the average for the period 2000-2010.
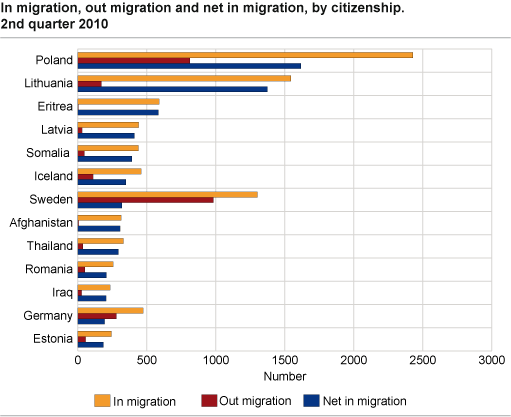
More immigrated and emigrated
During the 2nd quarter of 2010, 15 300 immigrations were registered; 2 100 more than the previous year and almost as many as the 2nd quarter of 2008. At the same time, there was an all time high emigration of 6 400. Overall, this gave the second highest migration gain in a 2nd quarter.
Since the 2nd quarter last year, the number of Polish citizens who came to Norway increased from 2 030 to 2 430, while the emigration decreased from 1 010 to 810. The net migration of Polish citizens thus increased from 1 020 in 2009 to 1 620 in 2010. However, this is much less than the net migration of more than 7 000 in the 2nd quarter of 2008. The net migration from Lithuania increased from 510 in 2009 to 1 370 in 2010, which is even higher than the level of 2008. The registered net migration of Swedes was 320 in the 2nd quarter of 2010.
During the first six months, 34 400 persons immigrated to Norway; 4 700 more than last year. In the same period, 14 700 emigrated from Norway; 1 500 more compared to last year. This adds up to a net migration of 19 700 for the whole country, which is 3 200 higher than the previous year.
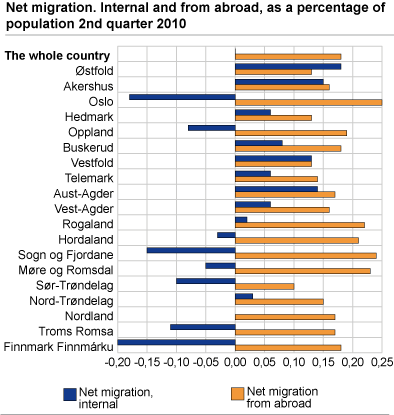
Biggest domestic migration surplus in Akershus and Østfold
During the 2nd quarter 2010, 10 counties had a domestic migration surplus, with Akershus and Østfold having the largest internal net migration, of 800 and 500 respectively. The remaining nine counties had a domestic migration deficit. Oslo in the lower end, with -1 100, followed by Sør-Trøndelag with -300.
| Total migration gain (302 in all) | Domestic migration gain (210 in all) | Migration gain from abroad (373 in all) | |||||||||||||||||||||||||||||||||||||||||||||||||||||||||||||||||||||||||||||
|---|---|---|---|---|---|---|---|---|---|---|---|---|---|---|---|---|---|---|---|---|---|---|---|---|---|---|---|---|---|---|---|---|---|---|---|---|---|---|---|---|---|---|---|---|---|---|---|---|---|---|---|---|---|---|---|---|---|---|---|---|---|---|---|---|---|---|---|---|---|---|---|---|---|---|---|---|---|---|---|
| 1 | Oslo | 406 | Fredrikstad | 265 | Oslo | 1 473 | |||||||||||||||||||||||||||||||||||||||||||||||||||||||||||||||||||||||||
| 2 | Fredrikstad | 345 | Skien | 166 | Bergen | 542 | |||||||||||||||||||||||||||||||||||||||||||||||||||||||||||||||||||||||||
| 3 | Skien | 245 | Os | 115 | Stavanger | 270 | |||||||||||||||||||||||||||||||||||||||||||||||||||||||||||||||||||||||||
| 4 | Bærum | 236 | ås | 112 | Bærum | 149 | |||||||||||||||||||||||||||||||||||||||||||||||||||||||||||||||||||||||||
| 5 | Drammen | 225 | Arendal | 100 | Kristiansand | 142 | |||||||||||||||||||||||||||||||||||||||||||||||||||||||||||||||||||||||||
| 6 | Sandnes | 186 | Askøy | 93 | Drammen | 138 | |||||||||||||||||||||||||||||||||||||||||||||||||||||||||||||||||||||||||
| 7 | Arendal | 176 | Røyken | 90 | Sandnes | 133 | |||||||||||||||||||||||||||||||||||||||||||||||||||||||||||||||||||||||||
| 8 | Ullensaker | 154 | Ullensaker | 88 | Trondheim | 102 | |||||||||||||||||||||||||||||||||||||||||||||||||||||||||||||||||||||||||
| 9 | Ski | 149 | Bærum | 87 | ålesund | 91 | |||||||||||||||||||||||||||||||||||||||||||||||||||||||||||||||||||||||||
| 10 | Skedsmo | 149 | Drammen | 87 | Skedsmo | 87 | |||||||||||||||||||||||||||||||||||||||||||||||||||||||||||||||||||||||||
| Total migration loss (121 in all) | Domestic migration loss (203 in all) | Migration loss to abroad (34 in all) | |||||||||||||||||||||||||||||||||||||||||||||||||||||||||||||||||||||||||||||
| 1 | Trondheim | -277 | Oslo | -1 067 | Meløy | -21 | |||||||||||||||||||||||||||||||||||||||||||||||||||||||||||||||||||||||||
| 2 | Lillehammer | -46 | Bergen | -489 | Mandal | -16 | |||||||||||||||||||||||||||||||||||||||||||||||||||||||||||||||||||||||||
| 3 | Bardu | -45 | Trondheim | -379 | Sør-Odal | -8 | |||||||||||||||||||||||||||||||||||||||||||||||||||||||||||||||||||||||||
| 4 | Bamble | -40 | Stavanger | -176 | Ulvik | -7 | |||||||||||||||||||||||||||||||||||||||||||||||||||||||||||||||||||||||||
| 5 | Volda | -37 | Lillehammer | -79 | Berg | -7 | |||||||||||||||||||||||||||||||||||||||||||||||||||||||||||||||||||||||||
| 6 | Nesodden | -34 | Kristiansand | -67 | Bø | -6 | |||||||||||||||||||||||||||||||||||||||||||||||||||||||||||||||||||||||||
| 7 | Nome | -28 | Bodø | -57 | Fjaler | -6 | |||||||||||||||||||||||||||||||||||||||||||||||||||||||||||||||||||||||||
| 8 | Fjaler | -24 | Volda | -55 | Oppdal | -6 | |||||||||||||||||||||||||||||||||||||||||||||||||||||||||||||||||||||||||
| 9 | Gjemnes | -24 | Bardu | -55 | Vågå | -5 | |||||||||||||||||||||||||||||||||||||||||||||||||||||||||||||||||||||||||
| 10 | Selbu | -23 | Nesodden and Bamble | -54 | Levanger and Røst | -5 | |||||||||||||||||||||||||||||||||||||||||||||||||||||||||||||||||||||||||
|
Excess of births
(251 in total) |
Excess of births in relation to population /
1 000 (251 in total) (Norway = 1.2) |
Population growth
(303 in total) |
Population growth in relation to population /
1 000 (303 in total) (Norway = 3.0) |
||||||||||||||||||||||||||||||||||||||||||||||||||||||||||||||||||||||||||||
|---|---|---|---|---|---|---|---|---|---|---|---|---|---|---|---|---|---|---|---|---|---|---|---|---|---|---|---|---|---|---|---|---|---|---|---|---|---|---|---|---|---|---|---|---|---|---|---|---|---|---|---|---|---|---|---|---|---|---|---|---|---|---|---|---|---|---|---|---|---|---|---|---|---|---|---|---|---|---|---|
| 1 | Oslo | 1 635 | Utsira | 9.2 | Oslo | 2 041 | Bygland | 18.0 | |||||||||||||||||||||||||||||||||||||||||||||||||||||||||||||||||||||||
| 2 | Bergen | 448 | Iveland | 5.5 | Bergen | 501 | Finnøy | 16.1 | |||||||||||||||||||||||||||||||||||||||||||||||||||||||||||||||||||||||
| 3 | Trondheim | 347 | Rælingen | 4.6 | Stavanger | 391 | Herøy (Nordland) | 15.3 | |||||||||||||||||||||||||||||||||||||||||||||||||||||||||||||||||||||||
| 4 | Stavanger | 297 | Gáivuotna Kåfjord | 4.6 | Fredrikstad | 387 | Leka | 15.3 | |||||||||||||||||||||||||||||||||||||||||||||||||||||||||||||||||||||||
| 5 | Tromsø | 192 | Hå | 4.4 | Sandnes | 355 | Torsken | 14.4 | |||||||||||||||||||||||||||||||||||||||||||||||||||||||||||||||||||||||
| 6 | Sandnes | 169 | Lurøy | 4.2 | Drammen | 330 | Røyrvik | 14.3 | |||||||||||||||||||||||||||||||||||||||||||||||||||||||||||||||||||||||
| 7 | Drammen | 105 | Klæbu | 4.0 | Bærum | 322 | Frosta | 14.0 | |||||||||||||||||||||||||||||||||||||||||||||||||||||||||||||||||||||||
| 8 | Kristiansand | 105 | Tranøy | 3.9 | Skien | 296 | Aurland | 13.1 | |||||||||||||||||||||||||||||||||||||||||||||||||||||||||||||||||||||||
| 9 | Bærum | 86 | Førde | 3.6 | Skedsmo | 235 | Eide | 12.9 | |||||||||||||||||||||||||||||||||||||||||||||||||||||||||||||||||||||||
| 10 | Skedsmo | 86 | Time og Naustdal | 3.4 | Ullensaker | 223 | Hitra | 12.8 | |||||||||||||||||||||||||||||||||||||||||||||||||||||||||||||||||||||||
|
Birth deficit
(155 in total) |
Birth deficit in relation to population /
1 000 (155 in total) |
Population decrease
(113 in total) |
Population decrease in relation to population /
1 000 (113 in total) |
||||||||||||||||||||||||||||||||||||||||||||||||||||||||||||||||||||||||||||
| 1 | Nord-Odal | -15 | Rømskog | -7.4 | Lillehammer | -58 | Træna | -16.1 | |||||||||||||||||||||||||||||||||||||||||||||||||||||||||||||||||||||||
| 2 | åsnes | -14 | Gamvik | -5.9 | Bardu | -38 | Kvalsund | -15.7 | |||||||||||||||||||||||||||||||||||||||||||||||||||||||||||||||||||||||
| 3 | østre Toten | -13 | Berlevåg | -5.7 | Bamble | -37 | Berg | -13.1 | |||||||||||||||||||||||||||||||||||||||||||||||||||||||||||||||||||||||
| 4 | Søndre Land | -13 | Moskenes | -5.3 | Volda | -32 | Bjarkøy | -12.4 | |||||||||||||||||||||||||||||||||||||||||||||||||||||||||||||||||||||||
| 5 | Vågan | -13 | Dyrøy | -4.9 | Nome | -25 | Lierne | -11.9 | |||||||||||||||||||||||||||||||||||||||||||||||||||||||||||||||||||||||
| 6 | Halden | -12 | Osen | -4.8 | Verran | -25 | Lebesby | -11.9 | |||||||||||||||||||||||||||||||||||||||||||||||||||||||||||||||||||||||
| 7 | Lillehammer | -12 | Flå | -4.0 | Meløy | -24 | Modalen | -11.4 | |||||||||||||||||||||||||||||||||||||||||||||||||||||||||||||||||||||||
| 8 | Hol | -12 | Træna | -4.0 | Sokndal | -22 | Måsøy | -10.3 | |||||||||||||||||||||||||||||||||||||||||||||||||||||||||||||||||||||||
| 9 | Sunndal | -12 | Kvitsøy | -3.8 | Gjemnes | -22 | Kvænangen | -9.9 | |||||||||||||||||||||||||||||||||||||||||||||||||||||||||||||||||||||||
| 10 | Trysil og Askvoll | -11 | Askvoll | -3.7 | Selbu | -22 | Namsskogan | -9.7 | |||||||||||||||||||||||||||||||||||||||||||||||||||||||||||||||||||||||
The statistics is published with Population.
Contact
-
Statistics Norway's Information Centre
E-mail: informasjon@ssb.no
tel.: (+47) 21 09 46 42